S&P 500 Strategy List & Best S&P Strategy to Trade S&P - List of Strategies to Trade S&P and List of S&P Strategies S&P Trading
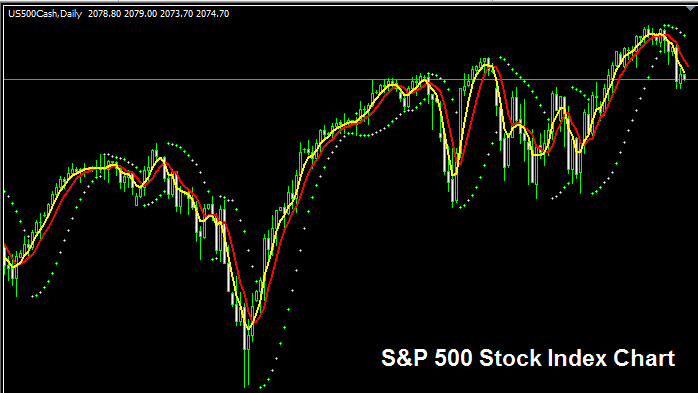
The S and P 500 Index Trading Chart
The S&P 500 Index trading chart is shown and illustrated above. On the above example this instrument is named US 500CASH. As a trader you want to find a broker that provides S&P 500 Index trading chart so that you can begin to trade it. The Indices example above is of S&P 500 Stock Indices on MT4 Forex and Stock Indices Trading Software.
Trading S&P Index and How to Trade S&P Index on MT4 - S&P 500 Index Trading
S&P 500 Trading Strategy - S&P Trading Strategy and S&P Forex Strategy
List of Best Strategy to Trade S&P and List of S&P Strategies - S&P 500 Index Trading
Indices Trade System - How Do You Trade S&P 500 Index?
- Creating Stock Indices Trade System
- Creating Trading Indicator Stock Indices Trade System
- Indices Trade System Rules
- How to Generate Stock Indices Trade Signals
- BackTesting Stock Indices Trade Systems
- Tips for Stock Indices Trade Systems for Beginner Traders
Moving Average Strategy - Tutorial for Trading S&P 500 Index
- About MA Stock Indices Trade Strategy
- Trading Short-Term & Long-Term Stock Indices Price Period of MA Moving Average
- How Do You trade Indices with MAs Moving Averages - SMA, EMA, LWMA SMMA
- Moving Average Stock Indices Whipsaws in Range Market
- Moving Average Stock Indices Crossover Strategy
- Indices MA Moving Average Support & Resistance Levels Trade Strategy
- How to Choose Stock Indices MA Moving Average to Trade With
- Short-term Stock Indices Trading with MAs Moving Averages
- Medium-term Stock Indices Trading with MAs Moving Averages
- Long-term Stock Indices Trading with MAs Moving Averages
- 20 Pips Price Range MA Stock Indices Trade Strategy
- Technical Analysis of MA Moving Average Indicator
MACD Strategies - List of S&P Trading Strategies
- MACD Center Line Crossover
- MACD Indicator Oscillator Stock Indices Technical Analysis Fast Line & Signal Line
- MACD Technical Analysis Buy and Sell Signals
- MACD Indicator Crossover Signals
- MACD Indices Classic Bullish & Bearish Divergence
- MACD Indices Hidden Bullish & Bearish Divergence
- MACD Indices Trading Whipsaws
- MACD Indices Trade Strategy Summary
RSI Strategies - S&P 500 Trading & List of S&P Trading Strategies
- RSI Indicator Stock Indices Trade Strategy
- RSI Indicator Overbought & Oversold Levels
- RSI Indicator Divergence Trading Setups
- RSI Indices Classic Bullish Divergence & Classic Bearish Divergence
- RSI Indices Hidden Bullish Divergence & Hidden Bearish Divergence
- RSI Swing Failure Stock Indices Trading Set Up Strategy
- RSI Indicator Chart Patterns & Stock Indices Trend Lines
- RSI Indicator Stock Indices Trade Strategy Summary
Bollinger Band Strategy - S&P Trading S&P Strategy
- Bollinger Band Trading Indicator Strategy
- How Bollinger Band Trading Indicator Works
- Bollinger Band Trading Indicator & Stock Indices Price Volatility
- Bollinger Band Trading Indicator Bulge & Squeeze Technical Analysis
- Bollinger Band Price Action in Trending Stock Indices Markets
- Bollinger Band Stock Indices Price Action in Ranging Stock Indices Markets
- Bollinger Band Stock Indices Trend Reversals
- Bollinger Band Stock Indices Trade Strategy Summary
Stochastics Strategy - S&P 500 Index Trading
- Stochastic Stock Indices Trade Strategy
- 3 Types of Stock Indices Trading Stochastic Indicators
- How Stochastic Oscillator Technical Indicator Works
- Stochastic Technical Indicator Overbought & Oversold Levels
- Technical Analysis of Stochastic Oscillator Indicator
- Stochastic Technical Indicator Crossover Signals
- Stochastic Oscillator Bullish Stock Indices Divergence & Bearish Divergence Trading
- Stochastic Technical Indicator Stock Indices Trade System
Guide for Trading S&P 500 Index - S&P 500 Indices Trade Strategies for Beginner Traders.


