RSI Technical Indicator Chart Pattern Setups & Trend-lines
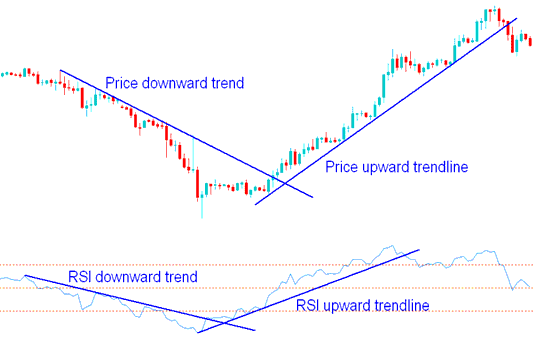
Traders can plot trend lines on the RSI in the same way as you can plot trend lines on the Index price charts. RSI trend lines are plotted the same way Indices trend lines are plotted on the Indices trade chart: by joining consecutive highs of the RSI or consecutive lows on the RSI Indicator.

RSI Trend Lines and Trend-lines on Stock Indices Trade Charts
RSI Pattern Setups in Index Trade
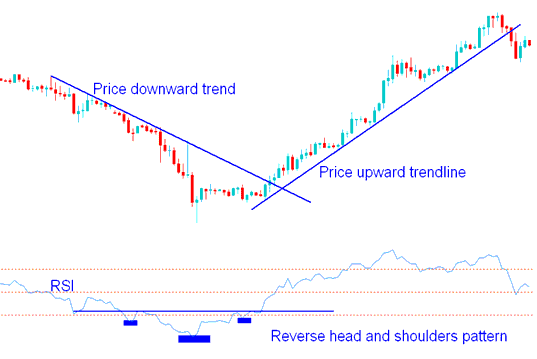
RSI chart patterns such as head-and-shoulders or triangle formations often emerge on the RSI indicator rather than directly on an asset's price chart. These patterns provide useful trade signals.
Additionally, the Relative Strength Index (RSI) can form chart patterns like head and shoulders or triangles that may not be apparent on the price chart. The Indices trade chart below clearly illustrates an Inverse Head and Shoulders reversal formation using the Stock Index RSI indicator.

Chart Patterns on RSI Trade Chart Indicator
Support & Resistance Levels using RSI Indicator
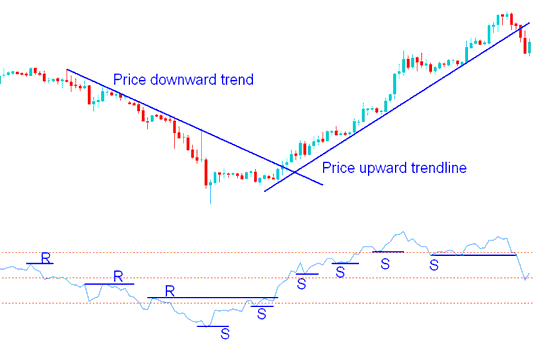
Sometimes you can see Stock Index trading support and resistance areas better on the RSI than you can see them on the Indices price graph.
In an upwards Index market trend the support areas should not be broken at any one time, if they are broken then price will also break the support levels & the upwards Stock Index trend is going to reverse.
In a downwards Indices trend the resistance levels shouldn't be broken, if they are broken then price will also break the resistance levels, and the downward Index trend is going to reverse.

Support and Resistance Levels on RSI Indicator
In the Indices example above when the third resistance level was broken the downward trend reversed to an upwards Index trend & when the sixth support was broken the upwards Stock Indices market trend reversed and broke the upwards Index trend line.
Study More Guides and Courses:
- What Is a Trading Chart for the FRA40 Index?
- A Lesson and Tutorial on Trading the Eurostoxx 50 Stock Index
- Which Forex Pairs Are Most Suitable for Novice Traders to Engage With?
- How to Build a Simple XAU/USD Strategy
- How to Use MT5 Stochastic Indicator on MetaTrader 5 Platform
- Instructions for Employing the Ultimate Oscillator Indicator within MetaTrader 4
- How do you set up the Gann Trend Oscillator Expert Advisor?
- A Lesson on UK100 Index Trading Strategies and How to Trade It.
- Zooming In and Out of Gold Charts and Stepping Through on MT4
- Want a step by step guide for XAUUSD analysis? Here it is, free.

