Ultimate Oscillator Analysis and Trading Signals
Originally developed and used to trade stock and commodities markets.
This oscillator aims at striking a balance between leading signals & lagging signals given by common indicators.
- Leading - some indicators lead the market & give signals earlier than the optimum ideal time
- Lagging - some trading indicators lag the market so far that half of the move is over before a signal is generated.
The oscillator seeks balance, neither too ahead nor behind the market. This timing gives signals right when needed, earning its name.

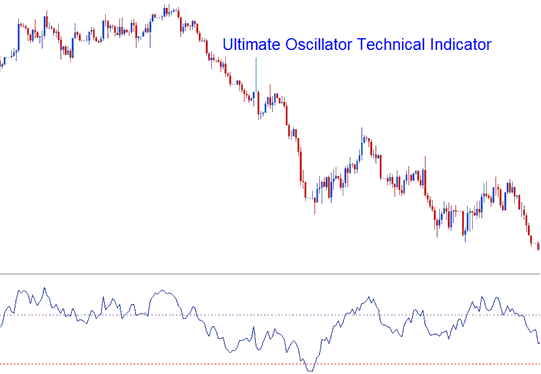
This tool looks at three sets of candles. It adds up weighted price moves from them. Then it shows values from 0 to 100. Scores over 70 signal overbought conditions. Scores under 30 signal oversold conditions.
The timeframe periods used to calculate ultimate oscillator trading indicator are 7 periods (short term trend), 14 periods (intermediate term trend) and 28 periods (long-term trend).
FX Analysis and Generating Signals
This technical measuring tool can be employed to derive buy and sell signals employing a variety of techniques and approaches.
Center line Crossover Signal
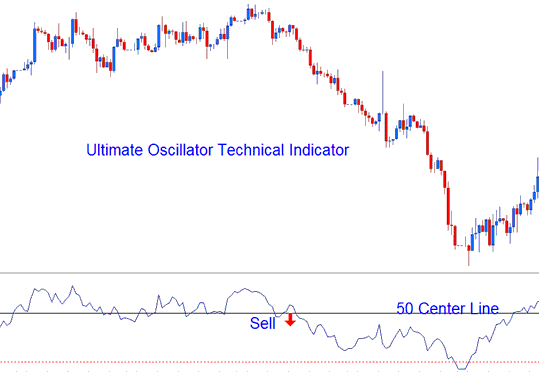
Buy Trade Signal - readings above 50 centerline level
Sell Signal - readings below 50 center line level

Center line Cross over Signal
Over-bought/Oversold Levels in Indicator
Overbought - levels above 70 - sell trade signal
Oversold - levels below 30 - buy trade signal
Divergence Trading
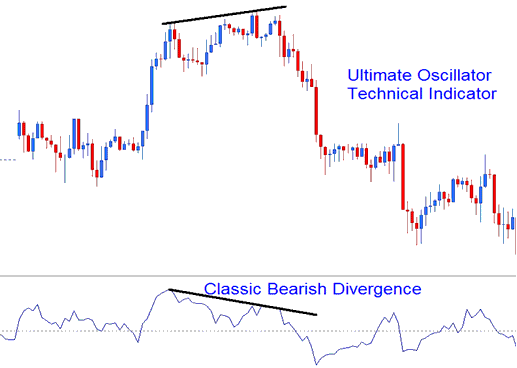
Traders can use the oscillator indicator to spot divergence signals. Here's a sample setup for a standard bearish divergence trade.

Technical Analysis
Learn More Lessons and Tutorials and Courses:
- Ways to Work Out Where to Put and Set Stop Loss Orders When Trading XAUUSD Simply
- Divergence Trading - Real Examples of Different Setups
- How do you use managed forex trading accounts?
- Options for MT4 Gold Charts on the Tools Menu Settings
- Setting GER 30 in MetaTrader 4 for PC
- Technical Analysis of the Ehler Fisher Transform for XAU/USD
- Figuring Out the Pip Size of the HangSeng50 Index
- Triple Exponential Average (TRIX) – Buy and Sell Signals
- How to Trade Hidden Bullish and Bearish Divergences on XAU/USD Charts
- How Can I Analyze/Interpret Chart Trading Analysis using Systems?
