
How to Trade Hidden Bullish and Hidden Bearish Divergence
Hidden divergence setup is used as a possible signal for a trend continuation after the price has finished retracing. It's a signal the original Gold price trend is resuming. This is the best divergence setup to trade because its signal is in the same direction as that of the continuing price trend.
Hidden Bullish Divergence Setup
A hidden bullish divergence forms when price hits a higher low, but the indicator shows a lower low. Picture it as W shapes on price charts for easy recall.
A hidden divergence scenario manifests during a retreat within an uptrending gold price movement.
The illustration below shows this setup - from the screen shot the price made a higher low (HL) but the technical indicator made a lower low (LL), this shows that there was a hidden divergence trading signal between the Gold price and the indicator. This hidden divergence signal shows that soon the market upwards trend is going to resume. In other words it shows this was just a retracement in an upward trend.
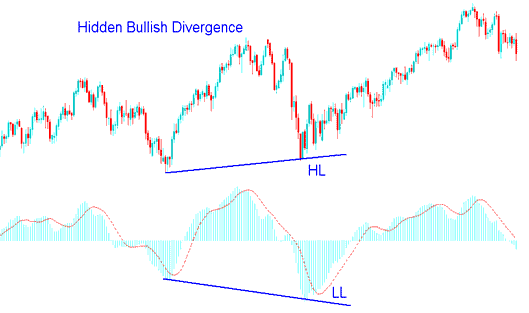
Hidden Bullish Divergence Trade Signal - XAUUSD Chart
This hidden bullish divergence trading signal confirms the completion of a retracement and suggests a strong underlying upward momentum.
Hidden Bearish Divergence
A hidden bearish divergence pops up when price forms a lower high, but the indicator shows a higher high. It's kind of like spotting an M shape on the chart - easy to remember once you see it.
A hidden bearish divergence setup is established when an ongoing downtrend experiences a temporary upward retracement.
The image below highlights a hidden divergence. Gold hit a lower high, but the indicator reached a higher high. This gap signals a divergence between price and tool. It points to the downtrend resuming soon. Put simply, it marks a pullback in the overall drop.
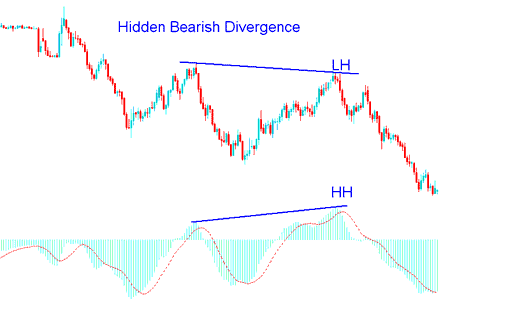
Hidden Bearish Divergence Trade Setup Signal - XAUUSD Trading Chart
This hidden divergence setup signals the end of a pullback. It highlights the downtrend's strength. Other tools like CCI, Stochastic, RSI, and MACD help too. MACD and RSI stand out as top picks.
Please note: The hidden divergence setup is arguably the most advantageous type of divergence signal to act upon. This is because its resulting trading signal aligns directionally with the dominant market trend, conferring a superior risk-to-reward profile by facilitating the most advantageous entry point for initiating a position.
Gold traders should pair this setup with tools like the stochastic oscillator or moving average cross. Buy when the indicator shows gold as oversold and the price exits that zone. Sell when it flags overbought and the price leaves that area.
Combining Hidden Divergence Setup with MA Cross over Method
Pair hidden divergence trades with a moving average. Use the MA crossover method. It builds a strong plan to spot and check signals before you trade.
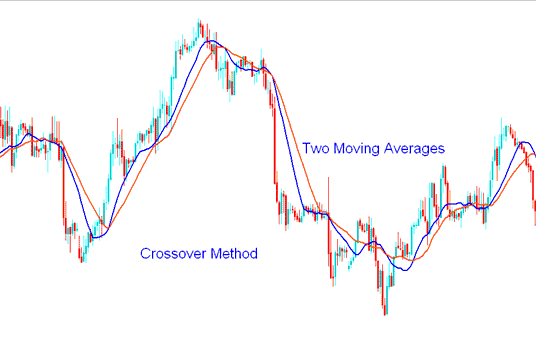
Moving Average Cross over Method - Gold Strategies
Using this plan, when the divergence trading signal shows up, a gold trader will then wait for the moving average MA cross over trading way to give a signal to buy or sell going in the same way as the trend:
- If there is a bullish divergence setup between the price and indicator, wait for the moving average crossover method to give an upward crossover signal before opening a buy transaction.
- While for a bearish divergence setup wait for the moving average crossover method to give a downwards bearish crossover signal before opening a sell trade transaction.
By combining this hidden divergence setup with other indicators this way, a trader will avoid whipsaws when it comes to trading Gold metal using this divergence trading setup.
Integration of Hidden Divergence Trade Signals with Fibonacci Retracement Levels
For this illustration, we will use an upward market trend and apply the MACD technical indicator.
The hidden divergence setup indicates that the prevailing price movement is merely a retracement within an upward trend: thus, we can integrate this divergence trading signal with the most favored retracement indicator, which is the Fibonacci retracements.
The illustration below demonstrates that when a hidden divergence setup appeared on the gold price chart, the price had just reached the 38.2% Fibonacci retracement. This level could have been an ideal point to initiate a buy order.
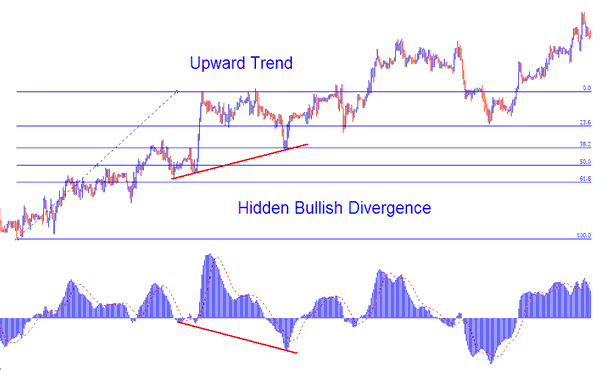
Integrating Signals from Hidden Divergence Trading with Fibonacci Retracement Levels
Hidden Divergence Signals with Fibonacci Extension Levels
In the example above, after opening a buy trade, a gold trader sets the take-profit level. Fibonacci Expansion Levels help with this calculation.
The Fib extension levels were drawn on the price chart like is shown below.
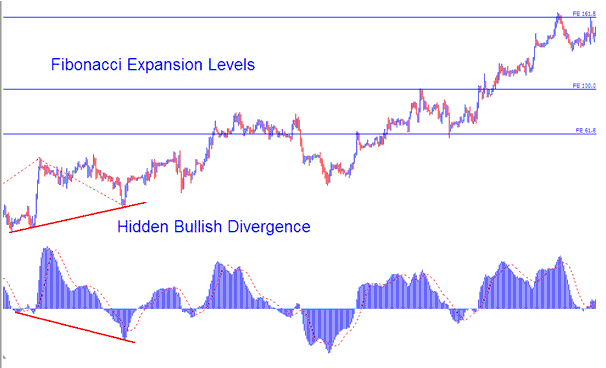
Combining Hidden Divergence Trade Signal with Fibonacci Extension Levels
In this example, three take-profit levels were set.
- Fibonacci Expansion Level 61.8%
- Fib Expansion Level 100.0%
- Fib Expansion Level 161.8%
Using this trading strategy that spots hidden differences, together with Fib tools, would have led to a good trading plan with a good amount of trading profit set using these Fib extension levels to set your take profit orders.
Further Subject Areas & Resources:
.