RSI Swing Failure Indices Trading Setup
RSI Stock Indices swing failure can be a very accurate method for trading short term Indices moves. It can also be used for trading long term trends but it is best suited for short term Indices trading especially for those Indices traders that trade reversals.
The RSI swing failure swing Stock Indices trading setup is a confirmation of a pending Stock Indices market reversal. This Stock Indices swing failure setups a leading breakout signal, it warns that a support or resistance level in the Indices market is going to be penetrated. This Stock Indices setup should occur at values above 70 for an upward Indices trend and values below 30 in a downward Indices trend.
Swing Failure In an Upward Indices Trend
If the Indices RSI Trading Indicator hits 79 then pulls back to 72, then rises to 76 & finally drops to below 72 this is considered a failure swing Stock Indices RSI setup. Since the 72 level is an RSI support level and it has been penetrated it means that price will and follow & it'll penetrate its support level.
In the example below, Indices RSI indicator hits 73 then pulls back to 56, this is a support level. The Indices indicator then rises to 68 & then drops to below 56, thus breaking the support level. The Indices price then follows afterwards breaking it support level. The Indices RSI swing failure is a leading Stock Indices trading signal and it's confirmed when price also breaks it support level. Some Indices traders open trades once the swing failure is complete while other Stock Indices traders wait for price confirmation, either way it is for a trader to decide what work best for them.
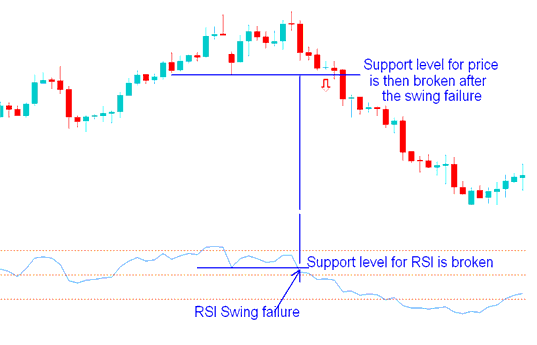
Indices RSI Swing Failure Setup in an Upward Indices Trend
Swing Failure In a Downward Indices Trend
If the Indices RSI Trading Indicator hits 20 then pulls back to 28, then falls to 24 & finally penetrates above 28, this is considered a failure swing setup. Since the 28 level is an RSI resistance level and it has been penetrated it means that Stock Indices price will and follow & it'll penetrate its resistance level.
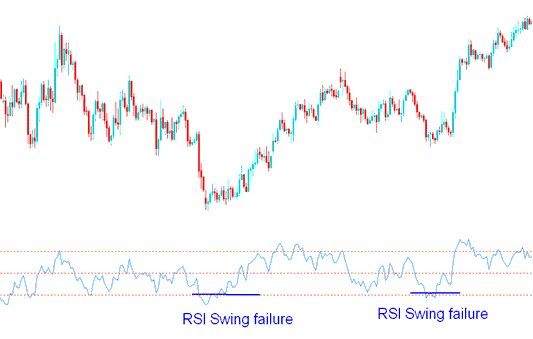
Indices RSI Swing Failure Setup in a Downward Indices Trend


