HK50 Index
The HK50 Index tracks market capitalization of top 50 companies that are displayed on Hong Kong Stocks Market. The companies shown are also chosen from the most lucrative economic sectors in Hong Kong.
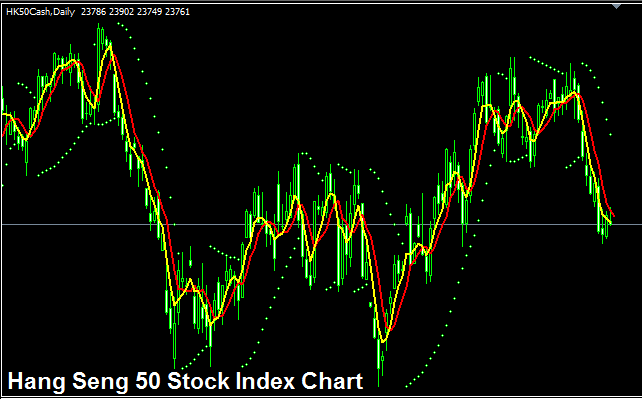
The HK50 Index Trading Chart
The HK50 Stock Indices trade chart is shown and illustrated above. On the above example this Stock Index is named HK 50CASH. As a trader you want to find a broker that provides HK50 Index trading chart so that you can begin to trade it. The example shown above is of HK50 Stock Indices on MT4 Forex and Indices Trade Software.
Other Information about HK50 Stock Indices
Official Indices Symbol - HSI:IND
The 50 component stocks that makes up HK50 Stock Indices are selected from the top companies in Hong Kong. The 50 stocks make up most of the trading turnover volume in the Hong Kong Stocks Market. The companies shown on this stock index represent a total of 60 % market capitalization of all securities shown in Hong Kong Stocks Market.
Stock Indices Trade System for Trading HK50 Index
The HK50 Index tracks capitalization of top 50 companies in Hong Kong. This Stock Indexes in general moves upward over long-term but it is more volatile in its trend movements. When compared to other indexes such as EURO STOXX and DAX30 which have lower volatility in their trend movements, this index has wider swings in its trend movements.
Over a long period of time this stock index will generally move upward, as a trader you want to be biased & keep buying as the index moves upward.
A good Indices trade strategy would be to keep buying the dips - although as a trader wanting to trade this stock index, be prepared for generally much wider swings when it comes to trading this stock index.
During Economic Slow-Down & Recession
During economic slow-down & recession times, companies begin to report lower profits & lower growth prospect. It is because to this reason that traders begin to sell stocks of companiesthat are reporting lower profits & therefore Indices tracking these specified stocks will also begin to move downward.
Therefore, during these times Stock Indexes trends are likely to be moving downward & you as a trader should also adjust your strategy accordingly to suit the prevailing downwards trends of the stock index that you are trading.
Contract Specifications
Margin Requirement Per Lot - HKD 450
Value per Pips - HKD 1
Note: Even though general trend is generally upwards, as a trader you have to consider & factor in daily market volatility, on some of the days the Indices might move in a range or even retrace and pull-back, the Indices market retracement move might also be a significant one at times & therefore as a trader you need to time your trade entry precisely using this trade strategy: Stock index trading strategy and at same time use proper money management guidelines just in case there is more unexpected volatility in the market trend. About stock indices trading money management rules courses: What is Stock Indexes money management & stock indices trading money management strategies.


