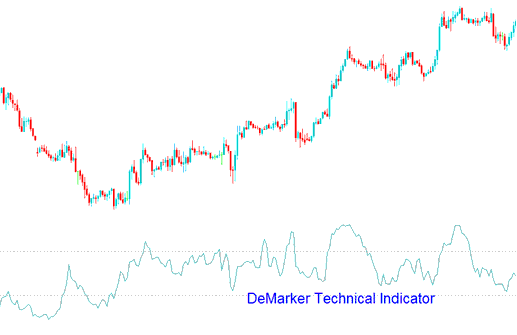
DeMarker Analysis & DeMarker Signals
Created and Developed by Tom Demark.
This indicator was specifically engineered to address the typical limitations found in conventional overbought and oversold measuring tools.
Traders use DeMarker to spot market lows and highs by checking price shifts bar by bar.

FX Technical Analysis & Generating Signals
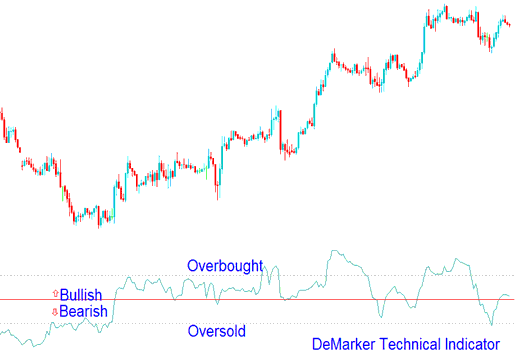
Read this indicator like other overbought or oversold ones. Overbought sits at 70. Oversold is at 30.
Bullish Reversal Signal - Anticipate a positive shift in price direction when the DeMarker moves beneath the 30 level.
Bearish Reversal Indicator - An expectation of a bearish price reversal arises when the DeMarker indicator crosses and moves above the 70 level.

Analysis in FX Trading
If you use longer time frames to draw the Demarker, you'll catch those big, long-term trends. On the other hand, switching to shorter time frames lets you jump in when the risk is low, so you can time your trades to line up with the bigger trend.
More Courses and Topics:
- Head and Shoulders Patterns: Spot Reversals with Regular and Inverse Setups
- Want to learn the NZD/JPY trading system and strategy? Here's the way.
- How do you draw downward trendlines on XAU/USD charts?
- Calculating Pip Values for the UK100 Index
- How to Trade Hidden Bullish & Hidden Bearish Divergence on XAUUSD Charts
- How to Interpret Charts
- Trend-line Break Trade XAU/USD Trend-line Reversal Signals
- How to Use MetaTrader 4 Forex Software on an Android Phone
- Inquiry: Can a MetaTrader 5 XAU/USD Expert Advisor (EA) be Developed and Traded on MT5 Software
- Interpreting Charts Using Various Indicators
