Trend Line Break - Trading Trend-Line Reversal Signals
After price of XAUUSD has moved in a particular direction for an extended time period within a channel it reaches to a point where the price stops moving within the channel. When this happens we say the trendline has been broken.
Since the trendline acts as a barrier of support or resistance, a breach of this line typically signals a forthcoming move in the opposite direction of the established market trend. This expectation arises because the price level that was previously maintaining the support or resistance status has now been penetrated. Upon such an occurrence, traders who held open buy or sell orders will often close them out immediately. This action is referred to as taking and booking profit.
Uptrend Reversal - Upwards Trend-Line Break
When the price crosses above a support line, the market will typically begin to decline or consolidate around that level before continuing downward.
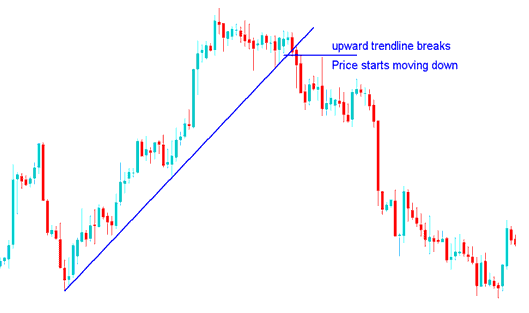
Upward Trend-Line Break
The double tops chart formation, marked by the appearance of a lower high or a lower low, signals the completion of this reversal. This situation simultaneously offers an opening for traders looking to take a short position on Gold should the established trendline be breached.
Downtrend Reversal - Downward Trend-Line Break
Should the price break below the lower boundary line (the resistance zone), the market is then likely to either advance or enter a period of sideways consolidation at this technical level before moving upwards.
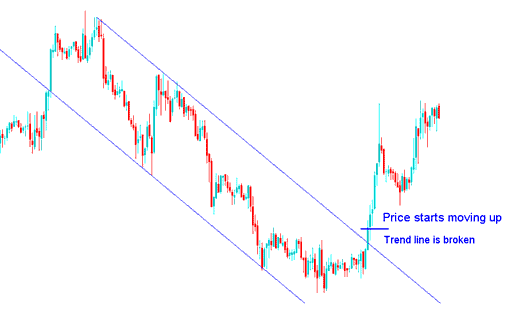
Downward Trend Line Break
The signal completes with a higher low or high in double bottoms. It breaks the trendline. Traders can then buy for a long position.
Note: Occasionally, when the price breaks its established trend, it may undergo a period of consolidation before proceeding in the new, opposing market direction. Regardless, it is prudent to utilize a take-profit order when the market direction reverses.
To trade this trend-line reversal setup as a trader once you open a new position in the direction of the market trend reversal the price should immediately head in that market direction, in a price break-out sort of manner. This means that the market should soon head in that particular direction without much of a resistance.
If the market doesn't immediately go in the direction of the price break, then it's best to close the trade because it means the trend is still going on.
Another helpful hint is to wait for the trendline to break, and for the market to settle above or below to prove it.
What happens is that most traders trade expecting a change even before the trend breaks, only for the price to touch the line, and for the current market trend to stay strong, so the XAUUSD metal prices keep going in the same market direction.
Hence, when trading this trend-line break reversal setup it is best to wait until the breakout has been confirmed by price closing above or below the trend line, based on the market direction of the price.
- Upward Market Direction Reversal - this signal gets confirmed once the market closes below this upwards trend line, this should be the correct time to open a short sell trade position, so as to avoid a whipsaw fakeout.
- Downwards Market Direction Reversal - this signal gets confirmed once the market closes above the downwards trend line, this should be the correct time to open a buy long trade position, so as to avoid a whipsaw fakeout.
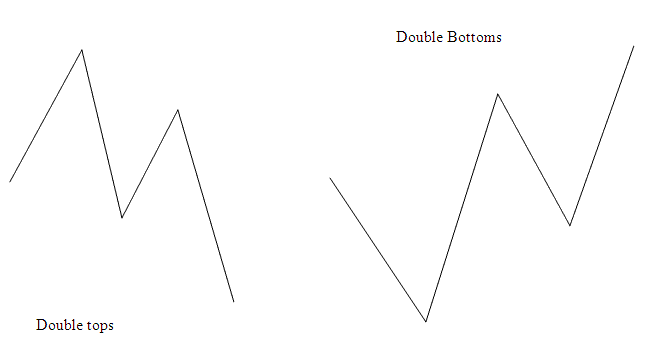
Combining Double Tops or Double Bottoms with Your Strategy
An effective trading setup to pair with this trend-line reversal scenario includes the double tops and double bottoms formations.
The double tops and double bottom chart reversal pattern should already be visible before the trend break signal appears. Because double tops and double bottoms also indicate possible trend reversals, using both patterns together can help XAU USD traders avoid false signals with a higher chance of success.
In these charts, double tops and bottoms form clear before the reversal kicks in.
The initial trading demonstration showcases an Upward Direction Reversal signal appearing on the XAUUSD price chart immediately following the prior formation of the Double Tops chart pattern.
Second take on reversal from down to up. The double bottom pattern formed on the gold trading chart before the trend break signal showed up.
Combining Double Top or Double Bottom Formations with Other Indicators Signaling Trend Reversal
Get More Topics and Tutorials:
- What's Best Index Platform for Beginners?
- Linear Regression Slope XAU USD Indicator Trading Analysis
- Index Trading Strategy Guide
- The Forex Morning Trades are When Most Forex Trades Happen
- Ehler's Relative Vigor Index (RVI) Indicator Analysis Explained
- Step-by-Step Guide to Drawing Downward Trendlines on Forex Charts