
Gold Trading Basics - Online XAUUSD Gold Trade Intro
Trading Gold online is becoming more popular among traders. XAUUSD is a financial trading option for trading online that a xauusd trader can decide to trade.
Its popularity makes XAUUSD liquid for online trading. With so many traders online, someone always wants to buy or sell gold contracts. This holds true any time the XAUUSD market is open.
This easy movement of money has also caused patterns to form in the way gold prices move. Because of these patterns, xau/usd can be looked at closely using trading analysis, and traders can figure out which way the xauusd market price might go.
XAUUSD has achieved sufficient liquidity to serve as a tradable instrument in the contemporary online market, prompting numerous online brokers to incorporate it within the range of financial assets available for client trading via their platforms.
Providers of online brokerage services that feature xauusd as a tradeable financial product are typically forex brokers. FX brokers have long served traders with currency exchange trading because the online currency exchange market stands as the largest and most liquid of all financial trading venues. This sheer liquidity is precisely why currency prices tend to move in discernible trends. Currency traders operating in the forex space employ analytical methods to gauge the trajectory of these prevailing market trends before executing trades in the currency market, aiming to profit from these shifts in value.
Given Gold's substantial increase in market prominence, its prices now exhibit trends that are open to technical analysis and trading. This market liquidity in XAUUSD is what facilitates the development of these discernible price trends. Furthermore, this high liquidity ensures the availability of sufficient market participants ready to buy or sell at any moment the gold market is operational.
The ensuing chart illustrates the price action for xauusd: traders utilize this visual representation for making gold/xauusd transactions.
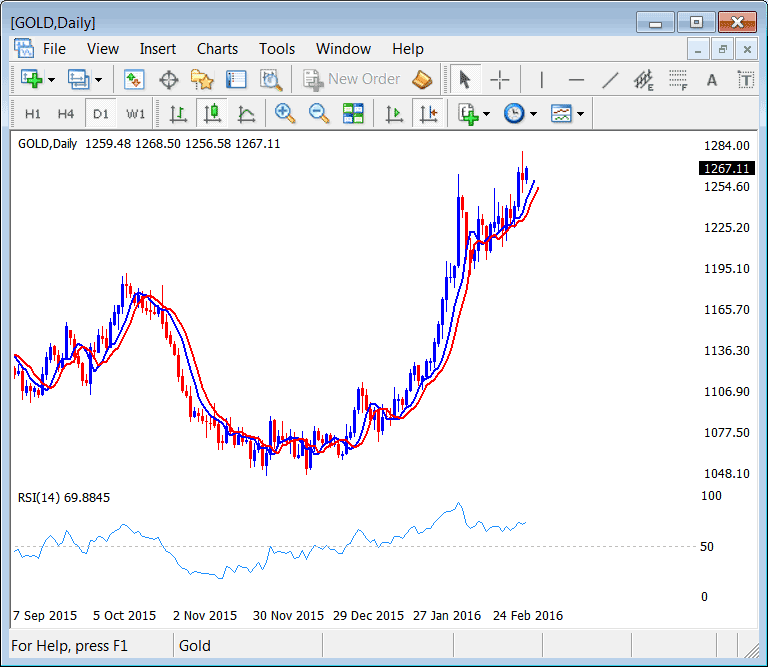
XAUUSD Price Chart
About XAUUSD Trading Charts
Based on the chart evidence above, a trader can rapidly ascertain the probable direction of xauusd prices by observing the movements.
Initially, prices are on the rise in a bullish trend, followed by a downward shift indicating a bearish market trend, and finally, prices rise again in another bullish trend.
As a beginner aiming to trade XAUUSD/gold, you must learn how to interpret these market movements.
Look at the chart up top. It shows a moving average crossover setup. This mixes two moving averages. They help spot the market's trend direction.
If both moving averages are rising, then the price of gold is generally going up. When prices are trending upward, a gold trader will buy gold and profit as the prices of xauusd keep climbing.
The moving averages will also tell you when the trend is changing. In the example, when the two averages stop going up and cross each other, it means the trend has changed, and traders should sell their trades.
After the moving averages crossed, they both turned and headed down. In a downtrend, a gold trader sells gold. They profit as long as prices keep falling.
The example above also uses the RSI indicator. This xauusd technical tool has a middle line at 50. When the tool is above this line, prices are expected to rise. If the RSI is above 50, it usually means prices are ending higher than they started, so the price is likely to go up. When the RSI goes below 50, it shows prices are often ending lower than they started, meaning prices are likely to fall.
Technical Analysis of XAUUSD Trading
In xauusd trading traders will use trading analysis and indicators like the ones shown above to determine the direction of the market prices. After figuring out the direction of the market prices a trader then will open trades in the direction of the market trend.
In an uptrend, gold traders buy. In a downtrend, XAUUSD traders sell.
Buying is referred to as going long and selling is referred to as going short.
Traders can earn money whether the market is going up or down. If the market is trending up, a trader will buy xauusd, which is called going long. If the market is going down, a xauusd trader will sell gold, which is known as going short.
Trading Gold Contracts
In online gold markets, trades happen as contracts. No physical gold changes hands. One XAUUSD contract equals 100 units.
In the online exchange market, if gold is measured in ounces, one contract of gold represents 1,000 ounces of gold.
Gold Prices
In the chart shown above the price of gold is shown on the trading chart. The price of gold will also have 2 numbers after the decimal, and that's how gold is priced.
Gold Charts
Use past gold prices to build a chart. Traders study it to guess the next trend direction. They read the moves with analysis tools and indicators.
The xauusd/gold chart is the main trading tool used to trade xau/usd.
Get More Tutorials and Lessons & Courses:
- What is the Trailing Stop Loss Levels Indicator?
- How to Add Ultimate Oscillator in MetaTrader 4 Charts Explained
- How Can Kurtosis Trading Indicator Be Used in Forex?
- EURCAD Trading System: Methods and Insights
- How to Perform Trade Analysis Using Charts in MT4
- Bears Power MT4 Indicator in Forex
- Analysis of MACD Divergence Specific to Indices
- How to Draw Fibonacci Extension Levels for Trend Analysis
- The MA crossover forex method: buy and sell signals through moving average crossover.