What is SX 50 Stock Indexes Trade Chart? - What is SX 50 Stock Indexes MetaTrader 4 Chart?
SX 50 Stock Indexes Trade Chart - SX 5E or SX 5E:IND
The SX 50 Stock Indexes is also Named as SX50 or EUR50 or SX50
The SX 50 Stock Index represents trend movement of top 50 Blue Chip Stocks in EuroZone. These stocks are picked from the most lucrative sectors of EuroZone economy. The Top 50 Stocks are also selected from a variety of Euro Zone countries. These 50 stocks are the most liquid stocks in the EuroZone. The countries Included are 12 in total and these are:
- Germany
- France
- Netherlands
- Portugal
- Spain
- Belgium
- Finland
- Italy
- Austria
- Greece
- Ireland
- Luxembourg
The SX 50 Stock Index is represented on a chart as a Financial Instrument just like currencies & stocks, & this Stock Index trade chart can be traded just like forex currency charts.
The SX 50 Stock Index trade chart movement can be analyzed using technical analysis & other indicators can be placed on this Stock Index Trade Chart.
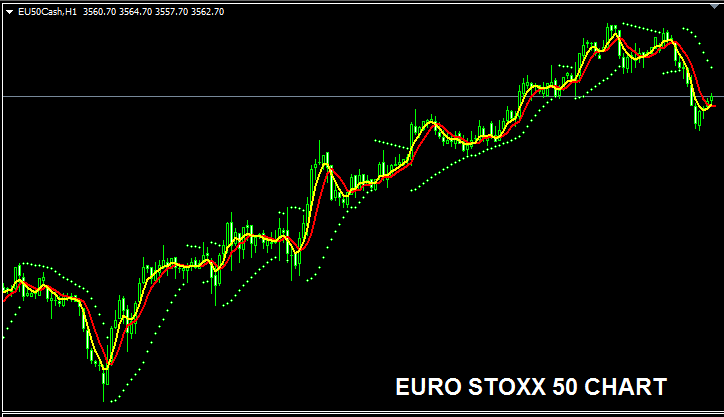
The SX 50 Stock Index Trade Chart
The SX 50 Stock Index trade chart is shown and illustrated below. On the example below this financial instrument is named SX50CASH. As a trader you want to find a broker that provides SX 50 Stock Index trade chart so that you can start to trade it. The example below is of SX 50 Stock Indexes on the MetaTrader 4 Forex & Indices Trading Software.
SX 50 Stock Indexes Trade Chart - The SX 50 Stock Indexes is also Named as SX50 or EUR50 or SX50
Just as currencies a trader can use their own indices trading strategy or Indices trading system to trade these Stock Indices the same way that they trade currencies. Traders can even use their Expert Advisors to trade these Stock Indices.
The 50 components stocks that makes up SX 50 Stock Index are revised once every year to determine if to make changes to this composition or not.


