UK100 Index
UK100 - Financial Times Stock Exchange Market, the UK100 stock index represents the Indices of the top 100 biggest companies in UK that are displayed in London Stock Market. The calculation of this stock index incorporates stocks which are determined quarterly. These stocks included in UK100 Index represent 80% of total market value of the London Stock Exchange Market shown firms.
Because the UK100 Indices tracks 100 companies the stock index will be more volatile as when compared to an index like Germany DAX30 which only tracks 30 companies.
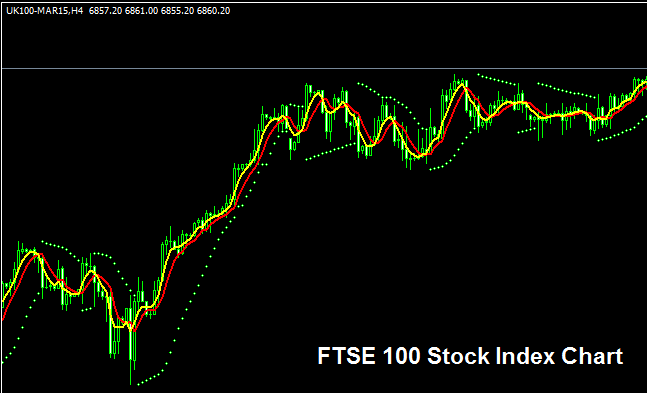
UK100 Chart
The UK100 Stock Index chart is displayed & shown above. On above example the index is named UK100CASH. As a trader you want to find an online broker that provides UK100 chart so that you as a trader can begin to trade it. Example displayed and illustrated above is of UK100 Indices on MT4 Forex Platform.
Other Details about UK100 Stock Index
Stock Index Symbol/Quote - UKX:IND
The 100 components stocks which constitute UK100 Stock Index are chosen from the best performing United Kingdom(UK) companies. The UK100 share index is closely followed as an indicator of the performance of UK businesses. The constituents that make up this stock index are re-evaluated quarterly. The calculation of this stock index is a simple formula based on the market capitalization.
Trading Strategy for Trading UK100 Index
The UK100 Stock Index shows relative movement of the top 100 stocks in UK. In general the share size of the top 100 corporations will keep moving upward, hence this stock index will also over time keep heading upward. Should a company not meet required business growth targets, the company will be removed from the index and replaced with an alternative company that has better business growth prospects.
As a trader wanting to trade this Stock Index, the over-all general market direction sentiment at any one particular time will be likely more bullish than bearish. This is because as long as these 100 companies that are that are being tracked and monitored are doing booming business, then their stock value will keep heading and moving upwards, & threfore this index will also keep moving and heading in an upwards market trend.
As a stock index trader you want to be biased & keep on buying as the index heads and moves upwards. When UK economy is performing good (most of the times it's performing good) this upwards trend is much more likely to be the one present. A good stock indices strategy would be to buy price dips.
During Economic Slow-Down & Recession
During the economic slowdown recession times, corporations begin to report lower revenues, lower profits and lowers growth projections. It is due to this reason that investors begin to sell stocks of companies which are announcing & reporting lower profits & therefore Indices tracking these specified stocks will also start and begin to move downwards.
Hence, during these times, market trends are more likely to be going down and you as a trader should also adjust your strategy accordingly to suit the prevailing downwards trends of the index which you as a trader are trading.
Contract Specifications
Margin Requirement for 1 Lot - £ 70
Value per Pip - £ 0.1
Note: Even though general and overall trend is generally move upwards, as a trader you've got to consider and factor on daily market price volatility, on some of the days the Indices may move in a range or even retrace and pull back, the Indices market retracement move might also be a substantial one at times and therefore you as the trader you need to time your trade entry strictly when using this strategy: strategy & at same time use suitable & proper and appropriate money management rules/guidelines just in case there is unexpected volatility in the market movement. About equity management principles/guidelines in stock indices courses: What is money Index management and indices money management plan/system.
More Guides:
- Choosing & Selecting the Right Analysis Forex Strategy for Beginner Traders
- Gold Leverage Definition in XAU USD
- US100 Indices Systems List and Best US 100 Indices System to Trade US 100
- Forex Brokers That Have FTSEMIB 40
- Gold Leverage
- List of the Different Types of Trade Accounts Explanation
- Examples of How to Set Up FX Currency Trades


