NETH25 INDEX - Amsterdam Bourse Stock Index
The NETH 25 Index is a Indices market indices used to track performance of top 25 stocks on NYSE Euronext Amsterdam Stock Exchange in Netherlands. The NYSE Euronext Amsterdam Stock Exchange was formally known as Amsterdam Stocks Market.
The 25 companies used to calculate this stock index are reevaluated quarterly every year. This Stock Indexes tracks on the capitalization of top 25 companies.
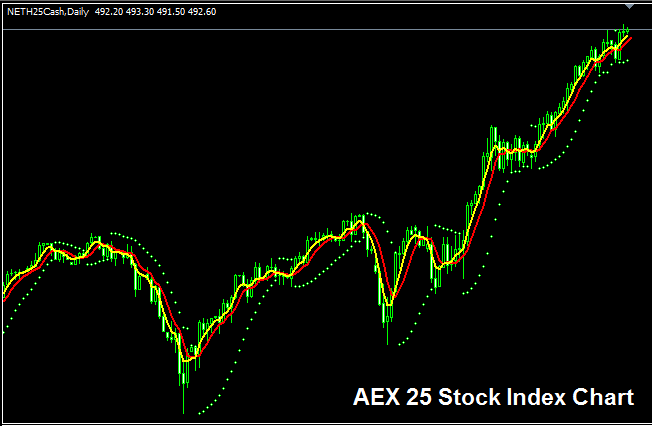
The NETH25 Index Trading Chart
The NETH25 Stock Indices trade chart is shown and illustrated above. On the above example this Stock Index is named NETH 25CASH. As a trader you want to find a broker that provides NETH25 Index trading chart so that you can begin to trade it. The example shown above is of NETH25 Stock Indices on MT4 Forex and Indices Trade Software.
Other Information about NETH25 Stock Indices
Stock Indices Symbol - NETH 25:IND
The 25 component stocks that makes up NETH25 Stock Indices are selected from the top companies in Netherlands. The 25 stocks make up most of the trading turnover volume in the NYSE Euronext Amsterdam Stocks Market. The Stock Index calculation is reviewed quarterly every yearly.
Stock Indices Trade System for Trading NETH25 Index
The NETH25 Index tracks capitalization of top 25 companies in Netherlands. This Stock Indexes in general moves upward over long-term because Netherlands economy also shows strong economic growth.
As a trader you want to be biased & keep buying as the index moves upward. When Dutch economy is doing well most of these top 25 stocks will continue to move up & therefore this stock index will also move in an upwards trend. A good Indices trade strategy would be to keep buying the dips.
During Economic Slow-Down & Recession
During economic slow-down & recession times, companies begin to report lower profits & lower growth prospect. It is because to this reason that traders begin to sell stocks of companiesthat are reporting lower profits & therefore Indices tracking these specified stocks will also begin to move downward.
Therefore, during these times Stock Indexes trends are likely to be moving downward & you as a trader should also adjust your strategy accordingly to suit the prevailing downwards trends of the stock index that you are trading.
Contract Specifications
Margin Requirement Per Lot - € 5
Value per Pips - € 0.1
Note: Even though general trend is generally upwards, as a trader you have to consider & factor in daily market volatility, on some of the days the Indices might move in a range or even retrace and pull-back, the Indices market retracement move might also be a significant one at times & therefore as a trader you need to time your trade entry precisely using this trade strategy: Index trading strategy and at same time use proper money management guidelines just in case there is more unexpected volatility in the market trend. About stock indices trading money management rules courses: What is Stock Indexes money management & stock indices trading money management strategies.


