SPAIN35 Index
SPAIN35 is an Stock Index which keeps track of the top 35 stocks in Bolsa Madrid - Spanish Stock Bourse. This Stock Index tracks the capitalization of 35 most liquid stocks in Madrid Stock Market. The component stocks used to calculate this stock index are revised twice a year.
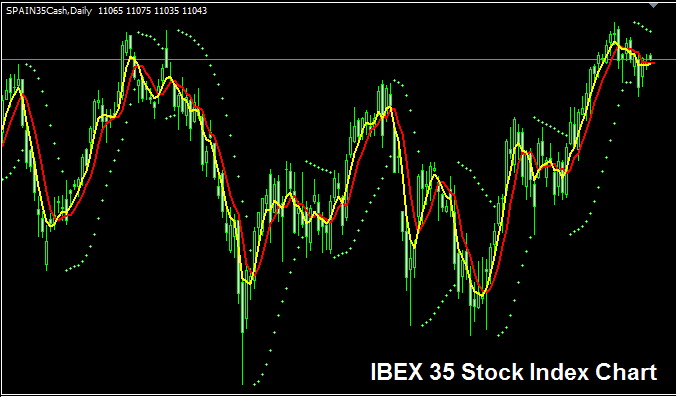
The SPAIN 35 Chart
SPAIN35 trading chart is illustrated and displayed above. On the above example this Stock Index is named SPAIN35CASH. As a trader you want to find a broker that provides SPAIN35 chart so that you as a trader can start to trade it. The example That is shown & illustrated above is that of SPAIN35 Indices on MT4 FX Platform Software.
Other Data about SPAIN35 Indices
Indices Symbol - SPAIN35
The 35 component stocks that makes up the SPAIN35 Index are selected from top companies in Spain. The 35 stocks make up most of the total turnover volume in the Madrid Stock Exchange.
Index Trading Strategy for Trading SPAIN35 Index
SPAIN35 Index tracks capitalization of top 35 corporations in Spain. This Stock Index in general moves upward over long-term but it's more volatile in its trend movement. When compared to other indexes such as EUROSTOXX 50 and DAX 30 which have lower volatility in their market trend movements, this stock index has wider swings in its trend movement.
Over a long period of time this index will in general moves move upwards, as a trader you want to be biased & keep buying as the index moves upward.
A good stock index trading strategy would be to keep buying and buy the dips - though as a trader wanting to trade this stock index, be prepared for generally much wider swings(more volatile swings) when it comes to trading this stock index.
During Economic Slow-Down and Recession
During the economic slowdown and recession periods, corporations begin and start to report slower earnings and lowers growth projections. It is due to and because of this reason that investors begin to sell stocks of companies that are recording and announcing lower profits and hence Indices tracking these specified stocks will also start and begin to move downwards.
Therefore, during these times, market trends are a lot more likely to be moving downward & you as a trader should also adjust your strategy accordingly to suit the prevailing downwards trends of the index which you as a trader are trading.
Contract Specifications
Margin Requirement for 1 Lot - € 140
Value per Pips - € 1
Note: Even though general and overall trend is generally move upward, as a trader you've got to consider and factor on daily market price volatility, on some of the days the Indices might move in a range or even retrace and pull back, the market correction/retracement move might also be a big one at times & hence as the trader you need to time your trade entry strictly using this trade strategy: strategy & at the same time use the proper and appropriate equity money management guidelines & rules just in case there's more unexpected market volatility. About money management methods/techniques in stock indices courses: What's money Index management & indices equity management methods/strategies.
Study More Guides & Topics:
- How to Use MT5 Coppock Curve Indicator
- Nasdaq100 Strategies Guide Download
- How Can I Trade MT5 FX Trend-Lines Trading Indicator and MT5 Channels Technical Indicator in MT5 Platform?
- SMA, EMA, LWMA & SMMA MAs Indices Examples
- Strategies for DJI 30 in FX
- How to Calculate Profit & Loss on a Cent Account Explained
- Pivot Points Technical Gold Indicator Analysis


