The SX 50 Index
The SX 50 Index shows movement of the top 50 Blue Chip Stocks in Euro Zone. These stocks are picked from the most profitable economic sectors of Euro-Zone economy. The Top 50 Stocks are also chosen and selected from a variety of Euro-Zone countries. These 50 stocks are the most liquid stocks in EU Zone. The countries Included are 12 in total and these are:
- Germany
- France
- Netherlands
- Portugal
- Spain
- Belgium
- Finland
- Italy
- Austria
- Greece
- Ireland
- Luxembourg
The SX 50 Index is represented on a chart as a Financial Trading Instrument just like the currencies and stocks, & this chart can be transacted just like fx charts.
The SX 50 trading chart movement can be interpreted using technical analysis & other indicators which can be added on this trading.
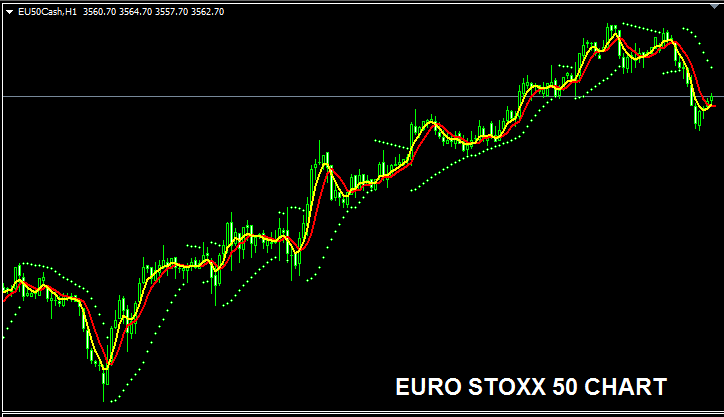
The SX 50 Chart
The SX 50 Stock Indices chart is displayed & shown below. On example laid-out below this financial instrument is named SX50CASH. As a trader you want to find a broker that provides SX 50 chart so that you as a trader can start to trade it. Example shown and displayed below is of SX 50 Indices on MT4 Forex Platform.
Just as currencies, a stock index trader can use their own strategy or trading system to trade these Indices the same way that they trade currencies. Traders can even use their Expert Advisors(EAs) to trade these Indices.
Other Details about SX 50 Stock Indices
Market Time - 0900 - 1800 CET
Official Symbol - SX 5E or SX5E
The 50 component stocks which constitute SX 50 Index are re-evaluated once each year to figure out if to make changes to this composition or not.
Trading Strategy For Trading SX 50 Index
The SX 50 Index is made up of blue chip stocks choosen from the top performing sectors in the Euro Zone: therefore a good indices trade strategy to trade SX 50 Index is to trade long majority of the times. This is because generally the best stocks in Europe will in general keep heading and going upward because the companies & corporations behind these stocks are among the best and most profitable companies in Europe.
The SX 50 Index is also re-evaluated yearly so that as if one Indices isn't doing good then it's replaced with an alternative Indices that is doing good. This ensures that most of the times SX 50 Index will keep moving upward.
As a stock index trader you want to be biased and keep on buying as the index heads & moves upwards. When the European based economies are performing well this upwards market trend is more likely to be the one that is present. A good stock indices trading strategy would be to buy price dips.
During Economic Slow-Down and Recession
During economic slowdown & recession periods, corporations begin to report lower revenues, lower profits and lowers growth projections. It is due to this reason that investors start to sell stocks of companies which are announcing lower profits and therefore Indices tracking these particular given stocks will also start to move and head downward.
Hence, during these times, trends are likely to be moving down & you as a trader should also adjust your strategy accordingly to suit the prevailing downwards trends of the index which you as a trader are trading.
Contract Specifications
Margin Requirement for 1 Lot - € 40
Value per Pip - € 0.1
Note: Even though general and overall trend is generally move upwards, as a trader you've got to consider and factor on daily market price volatility, on some of the days the Indices may move in a range or even retrace and pull back, the market correction/retracement move might also be a big one at times and hence you as a trader you need to time your trade entry strictly when using this trading strategy: Stock strategy & at same time use appropriate and proper/suitable money management strategies/guidelines just in case of more unexpected market volatility. About equity management guidelines and rules in stock indices tutorials: What is stock index money management strategies/guidelines & index equity management methods.
Learn More Guides and Topics:
- How Can I Add Gold Chart in MetaTrader 4 Platform Software?
- How Can I Trade MT4 Trade Chart Signals?
- Bollinger Bands Bulge and Bollinger Bands Squeeze XAUUSD Analysis
- The Main XAU USD Part of a XAU USD Plan is Your XAU USD Program
- USD/MXN FX Pair


