DJI 30 Industrial Average Indices or Dow 30 Stock Indices - Wall Street 30 Index
The DJI 30 Industrial Average Indices or Dow 30 Stock Indices is a Indices market indices that keeps track of 30 of the biggest stocks in USA. The stocks that are used to calculate this component are selected from 30 biggest companies in USA.
The DJI 30 is the most popular & most followed Indices globally. The DJI 30 Industrial Average originally tracked performance of Industrial stocks but has changed to include stocks from =the other sectors of the economy. The main criteria being the stocks chosen are from the largest American companies.
The DJI 30 is more volatile than most of the other Top Stock Indices, The DJI 30 although will over long-term trend upward it will have more price pullbacks & more consolidations than other Indices. Traders may prefer to trade other indexes other than the DJI 30 Industrial Average if they are more accustomed to trading more stellar trends found in other top stock indices.
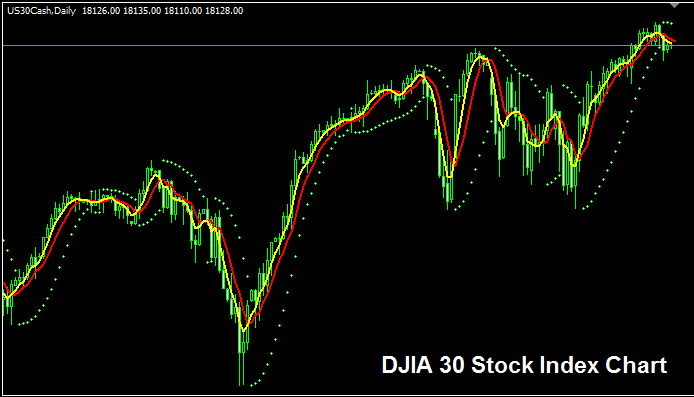
The DJI 30 Index Trading Chart
The DJI 30 Index trading chart is shown and illustrated above. On the above example this instrument is named DJI 30CASH. As a trader you want to find a broker that provides DJI 30 Index trading chart so that you can begin to trade it. The example shown above is of DJI 30 Stock Indices on MT4 Forex and Stock Indices Trading Software.
Other Information about DJI 30 Index
Stock Indices Symbol - DJI
The 30 component stocks that makes up DJI 30 Index are selected from the top American companies. The calculation of this stock index is however different compared to other Stock Indices; the price component of the 30 stocks is divided by a common divisor to come up with this stock index. This makes this stock index more volatile than others.
Strategy for Trading DJI 30 Index
The DJI 30 Index method of calculating make Dow 30 index more volatile & therefore there are more wide swings in price movement of this stock index. Although this stock index in general moves upward over long-term because American economy also shows strong growth & is also the largest economy in the world.
As a trader wanting to trade this stock index, be prepared for wider price swing & a little more volatility.
As a trader you want to be biased & keep buying as the index moves upward. When America economy is doing well (most of the times it is doing well) this upwards trend is more likely to be ruling. A good stock indices trade strategy would be to buy the dips.
During Economic Slow-Down & Recession
During economic slow-down & recession times, companies begin to report lower profits & lower growth prospect. It is because to this reason that traders begin to sell stocks of companiesthat are reporting lower profits & therefore Indices tracking these specified stocks will also begin to move downward.
Therefore, during these times Stock Indexes trends are likely to be moving downward & you as a trader should also adjust your strategy accordingly to suit the prevailing downwards trends of the stock index that you are trading.
Contracts and Specifications
Margin Requirement for 1 Lot - $ 150
Value per Pips - $ 0.5
Note: Even though general trend is generally upwards, as a trader you have to consider & factor in daily market volatility, on some of the days the Indices might move in a range or even retrace and pull-back, the Indices market retracement move might also be a significant one at times & therefore as a trader you need to time your trade entry precisely using this trade strategy: Stock index trading strategy and at same time use proper money management guidelines just in case there is more unexpected volatility in the market trend. About money management methods in Indices topics: What is Stock Indexes money management & Indices money management methods.


