RSI Trading Indicator Overbought & Oversold Levels
RSI Stock Indices indicator values of above 70 are considered to be overbought: Stock Indices traders consider points above the 70 level as market tops & good points for taking profits.
RSI Stock Indices indicator values of below 30 are considered to be oversold: Stock Indices traders consider points below the 30 level as market bottoms & good points for taking profits.
These overbought & oversold Indices levels should be confirmed by RSI center line crossovers trading signals. If these regions give a market top or bottom, this Stock Indices trading signal should be confirmed with RSI center line crossover Stock Indices signal. This is because these overbought & oversold levels are prone to giving whipsaws in the Indices market.
In the example below, when the RSI hit 70, it showed that the Indices trend was overbought, & this could be considered a trading signal that the Indices trend could reverse.
The market trend then reversed the trend after a short while and started to move downwards, until it got to the oversold levels. This was considered a Indices market bottom after which the market trend started to move upwards again.
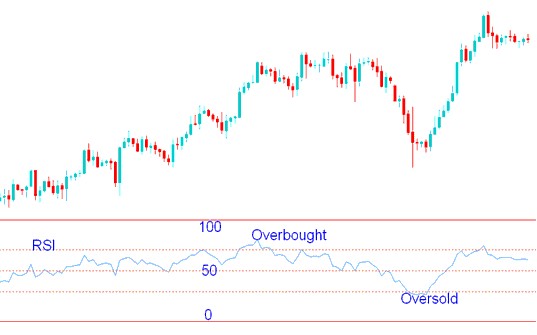
Overbought & Oversold Levels - RSI Stock Indices Trade Strategies
Over Extended Overbought & Oversold Levels
When the Indices market is trending strongly upward or downward the RSI Stock Indices indicator will stay at these overbought & oversold levels for a long time. When this happens these overbought & oversold regions cannot be used as Stock Indices market tops & Indices market bottoms because the RSI Stock Indices indicator will stay at these levels for an extended period of time. This is the reason why we say that the overbought & oversold regions are prone to Stock Indices trading whipsaws & it's best to confirm these Indices trading signals using RSI center-line crossover strategy.
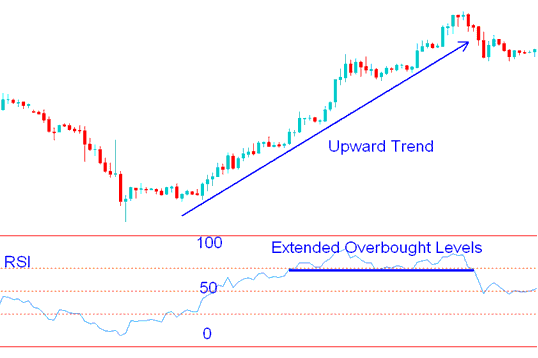
Over Extended Overbought & Oversold Levels - RSI Trading Indicator Strategy


