Trading Strategy Using Moving Average (MA) for Identifying Support & Resistance Levels
Moving Averages (MAs) can function effectively as reference points for support and resistance levels on index market charts.
When Indices price reaches and gets to the moving average, Moving Average level can act as a point of support/resistance for the Indices price.
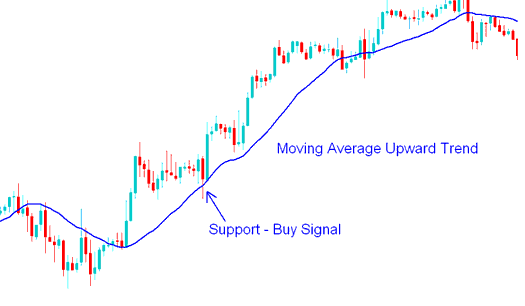
Buy Trading Signal
Should the price exhibit an upward trajectory and subsequently begin a downward correction, the majority of Index participants are likely to pause before entering a long position, opting instead to await a more advantageous entry price upon the market reaching a support level. Moving Averages (MA) are frequently employed by traders as a tool to pinpoint these support zones.
A buy Indices signal is derived & generated when price hits the Moving Average, turns & starts moving in the upwards market trend direction. The signal is confirmed when price closes above the MA. Because many Traders use the moving averages MAs to generate signals, price will in general react to these levels.
A stop loss should be placed just below the Moving Average Indicator. Ideally it should be placed a few pips below the previous low.

Buy Signal - How to Trade with MA(Moving Average) Strategy
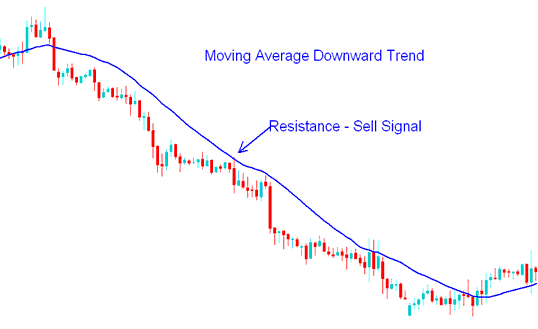
Sell Signal
When indices display a downward trend followed by a retracement, many traders may wait for prices to reach resistance levels before opening sell positions at more favorable prices. The Moving Average (MA) tool is often used to identify these resistance levels.
A sell Indices signal is triggered when the price touches the Moving Average, reverses, and begins moving in a downward trend. This signal is confirmed once the price closes beneath the Moving Average (MA). Given that numerous Traders utilize MAs for generating trading signals, price action generally reacts to these established levels.
A stop loss should be set a little above where the Stock Index moving average(MA) technical indicator is. It's best to put it a few pips above the last high point.

Sell Signal - How to Trade with MA(Moving Average) Strategy
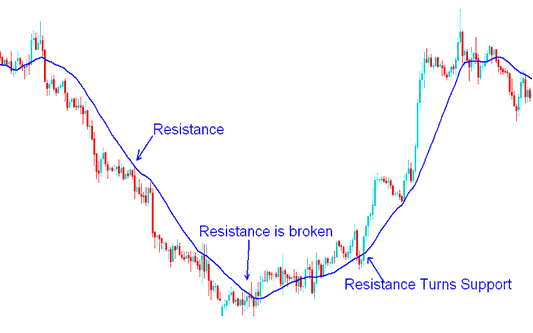
Resistance Level turns Support Level
In indices, a broken resistance level becomes support, and the reverse is true.
This happens when the fundamentals of a market trend change and consequently the direction of a trade chart. The direction change is reflected by the moving average Indices indicator, direction is confirmed when the resistance turns into support or vice versa (when support turns in to resistance)

Scenario Where a Resistance Level Converts into a Support Level - Example of a Stock Indices Trading System Using Moving Averages (MA)
Get More Guides:
- Start Online Live XAUUSD Account: Learn How to Setup XAU USD Account
- How to Place MT5 Aroon Oscillator in MT5 Forex Charts
- How to Trade UK100 Index Trading Strategies Guide Tutorial
- What's Ehler MESA Adaptive MA Moving Average Indicator?
- Bollinger Bands Activity: Analysis of Both Bulge and Squeeze Formations for XAUUSD
- Example of How is Free XAUUSD Margin Calculated on MetaTrader 4 Platform?
- What's FX Trend Lines Trading Indicator MT4 Platform?

