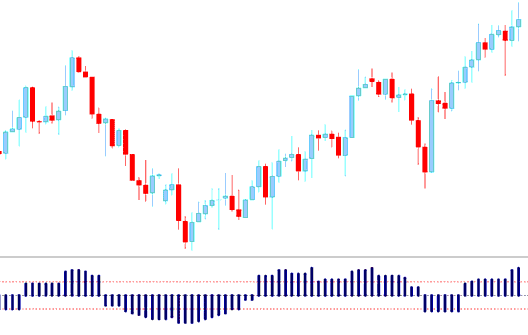
Aroon Oscillator Technical Analysis and Aroon Oscillator Signals
Calculated from Aroon Indicator.
Calculation
The oscillator is calculated by subtracting Aroon DOWN from Aroon UP.
The Oscillator oscillates between -100 & +100, this is because both Aroon UP and Aroon DOWN moves between Zero & 100.
Forex Technical Analysis & How to Generate Signals
Buy Forex Signal
The Oscillator gives a technical buy signal when it goes above the Zero line. The further it is from zero the stronger the up trend
The indicator shows price is gaining momentum if it keeps heading toward +100, and momentum is reducing if it is approaching the Zero mark.
Sell Trading Signal
The Oscillator gives a technical short signal when it goes below the Zero line. Further it's from zero the stronger the down trend
The indicator shows price is gaining momentum if it keeps moving toward -100, and momentum is reducing if it is approaching the Zero mark.
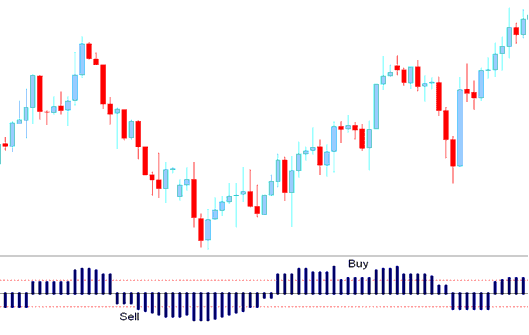
Aroon Oscillator and Sell Forex Signals - How to Analyze Aroon Oscillator Indicator


