Bollinger Bands for Spotting Double Tops and Bottoms Reversals
Wait for the price to change direction after it touches an Index Bollinger band before thinking a turnaround is actually taking place.
Even better a trader should see the price cross-over the MA.
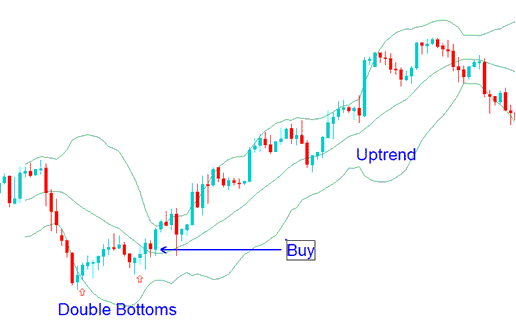
Double Bottoms Trend Reversals
A buy trading signal arrangement is called a double bottoms. When the price action penetrates the bottom Bollinger band, it then bounces back, creating and shaping the first price low, and then, after a period of time, the second price low is formed and shaped, this time above the lower band, the result is a double top.
The second price low cannot be lower than the first, and it is crucial that it not come into contact with or break through the lower Bollinger band. The price behavior confirms this positive trading arrangement when it rises and closes above the middle band (simple moving average).

Double Bottoms in Bollinger Bands: A Strategy for Identifying Trend Reversals Using the Double Bottoms Pattern
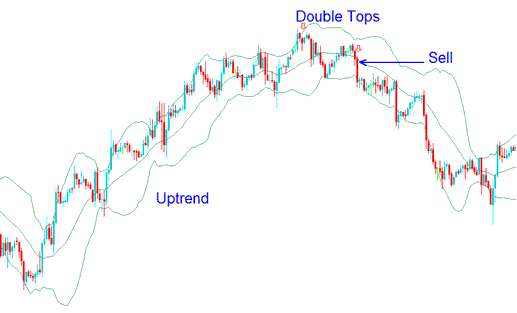
Double Top Trend Reversals
A double top pattern signals a potential selling opportunity. This occurs when the price action breaches the upper Bollinger Band and then retraces, forming the first peak, followed by a second peak that appears below the upper band.
It's crucial that the second price peak doesn't exceed the first one and that it doesn't touch or pass via the top Bollinger band. The price movement and closure below the center band (simple moving average) serve as confirmation of this bearish trading setup.

Trading Strategy Employing Bollinger Bands Trend Reversals in Conjunction with the Double Tops Pattern.
More Guides & Guides:

