How do you trade with stochastics bullish and bearish divergence?
Divergence in indices trading comes from signals like those from the stochastic oscillator.
Divergence Indices trading is a signal that a rally or retracement is losing steam and is likely to reverse. It means that last buyers or last sellers are pushing Indices price in one way while majority of other Indices traders have stopped trading in that direction and are cautious of a Indices price correction or pull back.
There are 4 types of Indices divergence setups
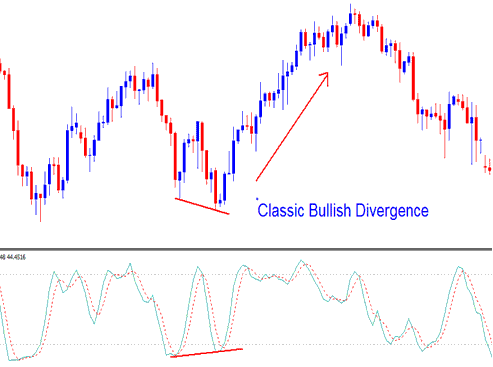
Example 1: Classic Stock Index Bullish Divergence Setup
A Indices Classic Bullish Divergence in the stochastic oscillator indicator and the Indices price is followed by a rise in Indices price.

Stochastic Indicator Classic Stock Index Bullish Divergence
When the Indices price is making new lows the Stochastic Indices indicator is not surpassing its previous lows it is an indication that the downward Indices trend is about to turn and reverse & a bullish rally is likely to occur.
The price hit a new low in the sample indices, but the stochastic oscillator indicator did not match. This divergence in the stochastic indicator is a typical setup for a possible trend reversal when a new low is established in price.
The indices classic divergence setup becomes stronger when combined with a rise beyond the 20% indicator level. This pairing integrates the Overbought and Oversold levels with the divergence setup for enhanced effectiveness.
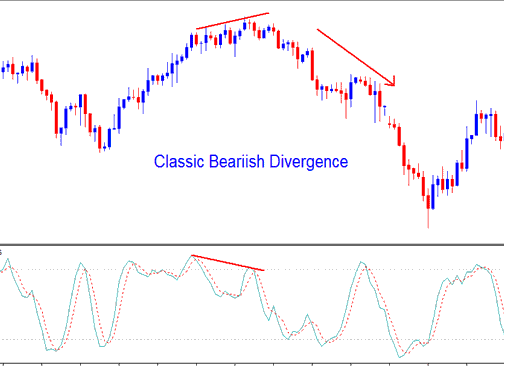
Example 2: Classic Stock Index Bearish Divergence
If the stochastic oscillator shows a Classic Indices Bearish Divergence and the Indices price then the Indices price will probably drop.

Stochastic Indicator Classic Stock Index Bearish Divergence
Index prices hit fresh peaks. Yet the Stochastic oscillator stays below its prior high. This hints at an end to the uptrend. A bearish divergence trade setup often follows for indices.
This classic bearish divergence setup in Indices is stronger when combined with a dip below the overbought 80 level.
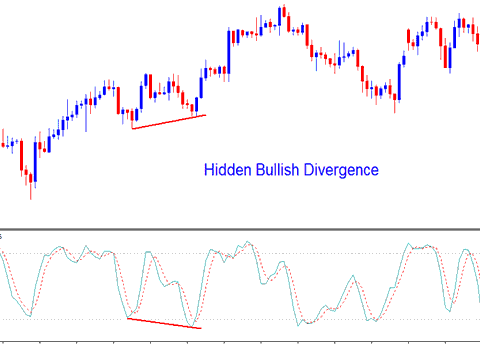
Example 3: Hidden Stock Index Bullish Divergence
The Hidden Indices Bullish Divergence trading setup indicates a pullback during an upward trend in indices. This type of hidden divergence pattern is considered the optimal index divergence setup because it allows traders to operate within the prevailing market trend instead of betting on a price reversal.

Stochastic Indicator Hidden Indices Bullish Divergence
Despite the stochastic oscillator indicator registering a lower trough, the price low for the Indices was actually higher than the preceding low (a higher low: HL). This divergence implies that although sellers exerted significant downward pressure, as signaled by the stochastic indicator, this was not reflected in the actual Index price, which failed to establish a new low. This juncture represents an optimal point to initiate a buy trade on the Indices, as being within an existing upward trend negates the necessity of waiting for further confirmation signals: you are buying in alignment with the dominant trend.
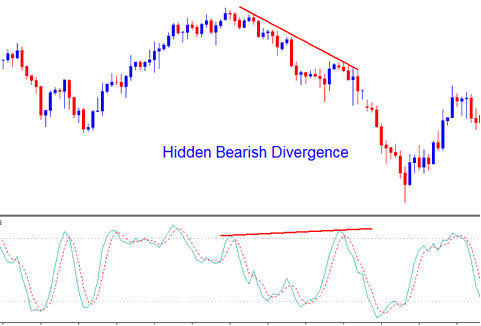
Example 4: Hidden Stock Indices Bearish Divergence
A Bearish Divergence indication spotted on Indices suggests a potential pullback within a declining Indices trajectory.

Stochastic Indicator Hidden Indices Bearish Divergence
Hidden Index bearish divergence Indices setup is the best type of divergence setup to trade, because you are not trading a Indices price trend reversal, but you are trading within the direction of the market trend. This is the best place to execute a sell trade, since it's even in a downward Indices trend there's no need for you to wait and chill for a confirmation Indices signal, because you're selling in a downward Indices trend.
Additional Instruction Sets, Instructional Material, and Programs:

