Creating Stock Indices Trade System: Indicator Stock Indices System
A Indices System refers to a set of stock indices trading rules that you follow to manage your Indices trades. These trading rules will determine when you open a Indices trade & when you will exit the open trade. A trade Stock Indices trading system is created by combining two or more technical indicators.
For example, the Stochastic Oscillator can be combined with other indicators to form a Stock Indices trading system. For this example stochastics can be combined with the indicators below to come up with the following Stock Indices trading system.
- RSI
- MACD
- Moving Averages
Example of Stock Indices trading system
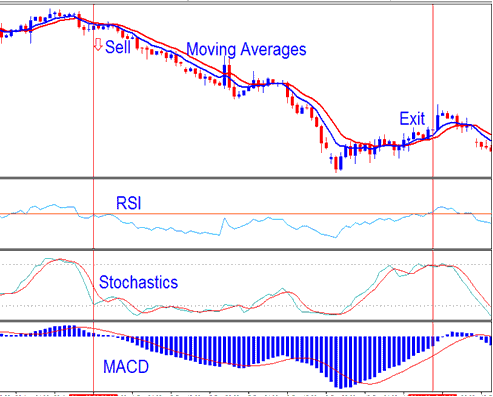
Creating Stock Indices System - Indices System Trading Example
So the question is how can one come up with a Stock Indices trading systems that work like the one above & how does one write it's rules? follow the steps below.
Seven steps to creating an indicator-based Stock Indices trading system
To come up with these set of Stock Indexes rules we use the following seven steps.
1. Choose your Chart Time Frame
This first step depends on how many hours you want to dedicate to Stock Indices trading. Whether you prefer sitting in front of the computer constantly for several hours analyzing short charts time frames OR you prefer setting up your Stock Indices trade charts using bigger time-frames once or twice a day. Choosing a Stock Indices trade chart time frame will mainly depend on what type of Stock Indices trader you are.
While testing your new Indices trading system you may want to find out about its performance on different chart time frames & then choose the most accurate & profitable Stock Indices trade chart time frame for you.
2. Choose indicators to identify a new trend
The goal of a trader is to get into the trade as early as possible & take maximum advantage of price moves.
One of the common ways to spot a new Indices trend as fast as possible is to use MAs Indicator. A simple Stock Indices strategy is to use a moving average Stock Indices crossover system that will identify a new trading opportunity at its earliest stage.
Moving Average Crossover Method - Indices Trade Strategy
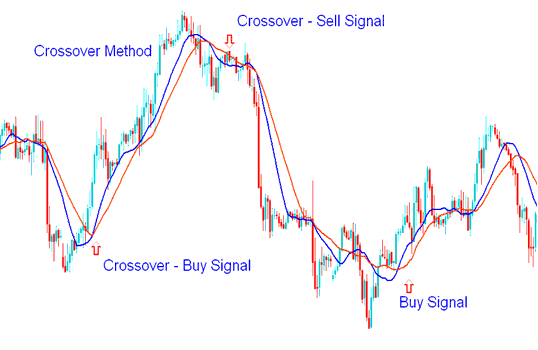
Sell signal & Buy signal Generated by Moving Average Crossover Method - Indices Trade Strategy
3. Choose additional Stock Indices indicators to confirm the trend
Once we find a new trend on the Stock Indices trade charts we need to use additional charts indicators that will confirm the entry signals & give either a green light for action or save a trader from fake-outs.
To confirm the Stock Indices trading signals we use RSI and Stochastic Oscillator.
RSI and Stochastic Oscillator Technical Indicator Stock Indices Trade System
4. Finding entry and exit points
Once the Stock Indices indicators are chosen so that one indicator gives the signal & another confirms the Stock Indices trading signal, it's time to enter a trade.
A Indices trader should enter as soon as a signal is generated & confirmed after a candlestick closes.
Aggressive traders enter a Stock Indices trade transaction immediately without waiting for the current price bar to close.
Most traders wait until the current price bar is closed & then enter the transaction if the Stock Indices trade setup has not changed & the signal remains valid. This method is more considerate & prevents additional false entries & whipsaws.
Generating Stock Indices Trade Signals - Trading Stock Indices Strategy
Generating Stock Indices Trade Signals - Trading Stock Indices Strategy
For exits, one can either set an amount of Stock Indices pips he wants to earn per trade or use technical tools that help to set profit goals like Fibonacci expansion or set a protective stop loss depending on the market volatility at any given time. Alternatively one can exit the Stock Indices trade when the indicators give an opposite signal.
When opening a new Indices trade transaction it is always important to calculate in advance how much you are willing to lose if the indices transaction goes against you.
5. Calculate risks in each setup
In Stock Indices you must calculate your risk for each Stock Indices trade. Serious Stock Indices traders will only enter look to open an order it the risk to reward ratio is 2:1 or more.
If you use a high risk to reward ratio like 2:1, you increase your chances of becoming profitable in the long run.
The Reward to Risk Chart below shows you how:
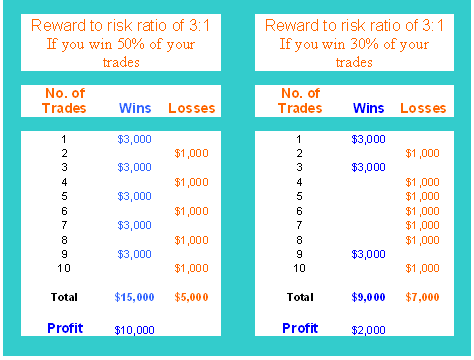
Money Management Reward Risk Chart - Indices Trade Strategy
In the first example of Risk to Reward Ratio, you can see that even if your Indices trading system only won 50% of your Stock Indices trades, you would still make a profit of $10,000 as shown on example above. Read more on this topic: Money Management Rules & Money Management Methods.
Before opening a new Indices trade, a trader should define the point at which he will close the trade if it turns to be a losing one. Some people use Fibonacci levels and support & resistance levels. Others just use a pre-determined stop loss to set stop loss order once they have opened a Stock Indices trade transaction.
6. Write down the Stock Indices systems trading rules & follow them
A Indices Trade System refers to a set of trade rules that you follow to manage your trades.
The keyword is A SET OF TRADING RULES which you must follow. If you don't follow the trading rules then you don't even have a Stock Indices trading system in the first place.
The next Stock Indices trading systems lesson shows you an example of how to use the above steps to come up with your own Stock Indices online trading system:
Next Lesson: Example of Writing Stock Indices Trade Systems Rules
7. Practice Stock Indices Trading on a Demo Account
Without enough trades, you'll not be able to realize the true profitability of your Stock Indices system.
Once you have your Stock Indices system rules written, it's time to test & improve your Stock Indices trade system by using it on a practice demo account.
Open a free demo account & trade your Stock Indices system to see how well it will respond.
It is strongly recommended to begin with a demo account & practice Stock Indices trading for at least for 1 or 2 months so that to gain some practice & experience how the Stock Indices market works.
Once you start making some a profit on your Stock Indices demo trading account you can then try opening a live Stock Indices trading account & begin trading online Indices.


