Bollinger Band Price Action in Trending Markets
The Bollinger Bands indicator helps find and study markets that are trending. When a market is trending, this indicator clearly points out if it's going up or down.
The Bollinger Band forex indicator can help determine the direction of the price trend. In an upward trend, the Bollinger Bands indicator will clearly show the direction of the price trend, which will be moving upward, and the price will be above the middle Bollinger.
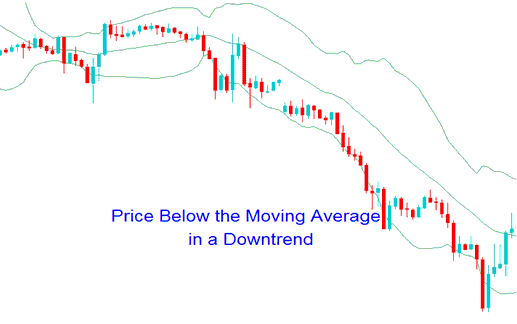
In a Down Trend, Prices Stay Under the Middle Band: Bands Point Down.
Watch Bollinger patterns on the indicator. A stock index trader can predict the market's next trend move.
Bollinger Band Patterns - Index Continuation Signals
Upwards Trend
- During an upswing, the candlesticks will stay within the upper Bollinger band the central moving average.
- Prices that close above the upper band are a sign of bullish continuation signal.
- Prices can hug/ride the upper band during an upwards market trend

Spot Upward Trends in Indices with Bollinger Bands Trading Plan
Downward Trend
- During a down swing, the candles will stay within the MA & the lower band.
- Prices that close below the lower band are a signal of bearish continuation signal.
- Prices can hug/ride the lower band during an downward trend

Spotting Downward Trends in Stock Indices with Bollinger Bands Trading Approach
Get More Lessons:
- Trading Strategy for the Nikkei Stock Index
- Wondering how to calculate the GBP/DKK bid-ask spread? Here's a quick method.
- Moving Average XAU/USD Indicator Analysis in XAU USD
- Opening Hours for SP 500 Index
- MT4 Tools for Making Forex Trend Lines and Channels
- Lessons to Learn How to Trade Using FX Guides
- What time does the Dow Jones 30 index open?

