FTSE100 Strategy List & Best FTSE Strategy to Trade FTSE - List of Strategies to Trade FTSE and List of FTSE Strategies FTSE Trading
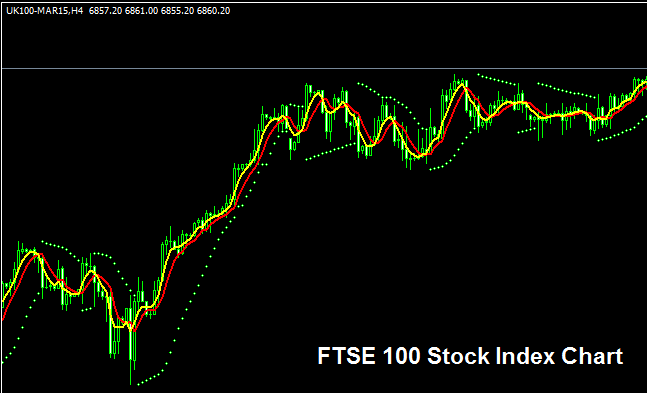
The FTSE100 Index Trading Chart
The FTSE100 Index trading chart is shown and illustrated above. On the example above the index is named UK 100CASH. As a trader you want to find an online broker that provides FTSE100 Index trading chart so that you can begin to trade it. The Indices example above is of FTSE100 Stock Indices on MT4 Forex and Stock Indices Trading Software.
Trading FTSE Index and How Do You Trade FTSE Index on MT4 - FTSE100 Index Trading
FTSE100 Trading Strategy - FTSE Trading Strategy and FTSE Forex Strategy
List of Best Strategy to Trade FTSE and List of FTSE Strategies - FTSE100 Index Trading
Indices Trade System - How to Trade FTSE100 Index
- Creating Stock Indices Trade System
- Creating Trading Indicator Stock Indices Trade System
- Indices Trade System Rules
- How Do You Generate Stock Indices Trade Signals
- BackTesting Stock Indices Trade Systems
- Tips for Stock Indices Trade Systems for Beginner Traders
Moving Average Strategy - Guide to Trading FTSE100 Index
- About MA Stock Indices Trade Strategy
- Trading Short-Term & Long-Term Stock Indices Price Period of MA Moving Average
- How to trade Indices with MAs Moving Averages - SMA, EMA, LWMA SMMA
- Moving Average Stock Indices Whipsaws in Range Market
- Moving Average Stock Indices Crossover Strategy
- Indices MA Moving Average Support & Resistance Levels Trade Strategy
- How Do You Choose a Stock Indices MA Moving Average to Trade With
- Short-term Stock Indices Trading with MAs Moving Averages
- Medium-term Stock Indices Trading with MAs Moving Averages
- Long-term Stock Indices Trading with MAs Moving Averages
- 20 Pips Price Range MA Stock Indices Trade Strategy
- Technical Analysis of MA Moving Average Indicator
MACD Strategies - List of FTSE Trading Strategies
- MACD Center Line Crossover
- MACD Indicator Oscillator Stock Indices Technical Analysis Fast Line & Signal Line
- MACD Technical Analysis Buy and Sell Signals
- MACD Indicator Crossover Signals
- MACD Indices Classic Bullish & Bearish Divergence
- MACD Indices Hidden Bullish & Bearish Divergence
- MACD Indices Trading Whipsaws
- MACD Indices Trade Strategy Summary
RSI Strategies - FTSE100 Trading & List of FTSE Trading Strategies
- RSI Indicator Stock Indices Trade Strategy
- RSI Indicator Overbought & Oversold Levels
- RSI Indicator Divergence Trading Setups
- RSI Indices Classic Bullish Divergence & Classic Bearish Divergence
- RSI Indices Hidden Bullish Divergence & Hidden Bearish Divergence
- RSI Swing Failure Stock Indices Trading Set Up Strategy
- RSI Indicator Chart Patterns & Stock Indices Trend Lines
- RSI Indicator Stock Indices Trade Strategy Summary
Bollinger Band Strategy - FTSE Trading FTSE Strategy
- Bollinger Band Trading Indicator Strategy
- How Bollinger Band Trading Indicator Works
- Bollinger Band Trading Indicator & Stock Indices Price Volatility
- Bollinger Band Trading Indicator Bulge & Squeeze Technical Analysis
- Bollinger Band Price Action in Trending Stock Indices Markets
- Bollinger Band Stock Indices Price Action in Ranging Stock Indices Markets
- Bollinger Band Stock Indices Trend Reversals
- Bollinger Band Stock Indices Trade Strategy Summary
Stochastics Strategy - FTSE100 Index Trading
- Stochastic Stock Indices Trade Strategy
- 3 Types of Stock Indices Trading Stochastic Indicators
- How Stochastic Oscillator Technical Indicator Works
- Stochastic Technical Indicator Overbought & Oversold Levels
- Technical Analysis of Stochastic Oscillator Indicator
- Stochastic Technical Indicator Crossover Signals
- Stochastic Oscillator Bullish Stock Indices Divergence & Bearish Divergence Trading
- Stochastic Technical Indicator Stock Indices Trade System
Tutorial for Trading FTSE100 Index - Guide to Trade FTSE100 Index


