How Do You Analyze/Interpret Price Action Trading Setups Combined with Indicators?
How can you interpret trading setups based on price action when combined with indicators?
Technical traders use charts to make decisions depending on chart price moves.
Price action strategies help traders analyze price movements. You can also mix these strategies with other indicators to build your own setup.
Clarification on Integrating Price Action Techniques with Supplementary Indicators
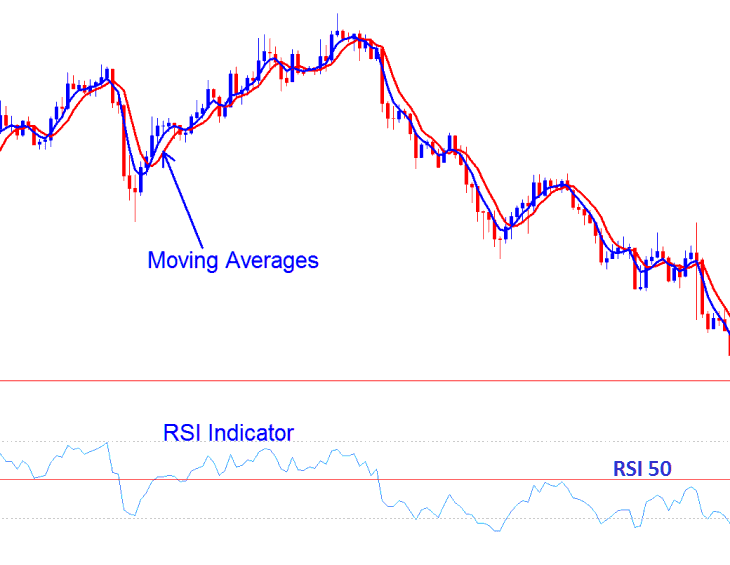
Traders can use trading indicators such as RSI and MAs Moving Averages to come up with a Price Action Setup Indicator System like the system examples shown:
Traders use other indicators to back up the signals that come from the way the price is moving, which they're already using.
Traders take positions only if breakout signals align with the prevailing trend indicated by technical tools.
Similar to any other indicator in XAUUSD analysis, the price action strategy is subject to whipsaws, thus necessitating its use as a supplementary approach combined with other signals, rather than relying on the price action strategy in isolation.

Combining Together Price Action Trade with other Indicators to Create a Price Action Trading Setups Strategy
Other Indicators to Combine Price Action Trade with are:
What Indicator to Combine Price Action Trade with?
How Do I Analyze Price Action Trading Setups Combined with Indicators
Additional Topics, Tutorials, and Lessons:
