RSI Indicator Chart Pattern Setups & XAUUSD Trend Lines
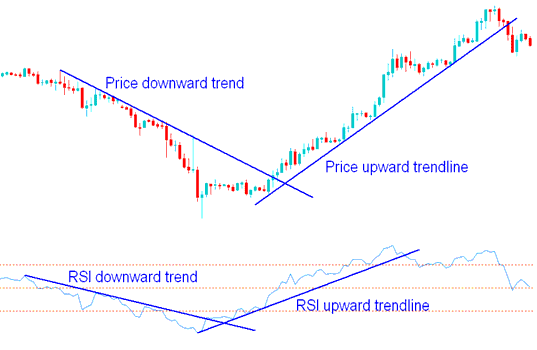
Traders can mark trend lines on the RSI just like they do on price charts. RSI trend lines are marked like trend lines on the chart: by connecting the highest points on the RSI indicator one after the other or the lowest points on the RSI Indicator one after the other.

RSI Trend-Lines and Trend lines in XAUUSD Charts
RSI Gold Pattern Setups in XAUUSD
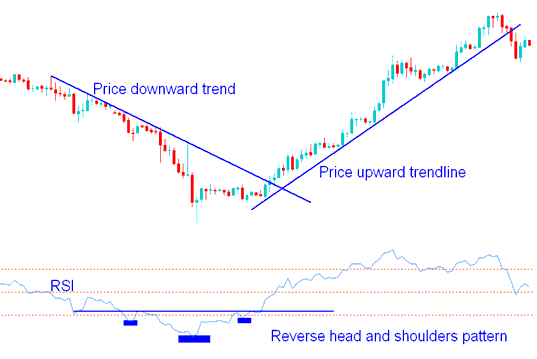
You'll sometimes see chart patterns like head and shoulders or triangles pop up on the RSI - even if they're missing from the price chart itself.
The RSI indicator frequently exhibits XAUUSD patterns such as head and shoulders or triangular gold chart formations, which might not always be apparent directly on the price chart. As illustrated in the chart below, the Reverse/Inverse Head and Shoulders reversal configuration is clearly visible on this XAUUSD RSI indicator.

Gold Chart Setups on RSI Gold Chart Indicator
Support & Resistance Areas using RSI Indicator
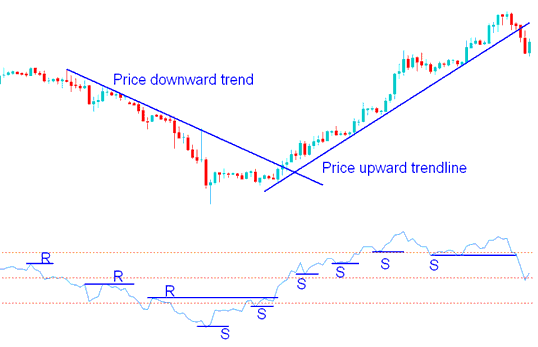
At times, the levels of support and resistance zones on gold charts are more effectively represented on the RSI indicator than on the price chart.
In an uptrend for XAUUSD, support zones stay intact. If they break, price drops below them. The uptrend then reverses.
In a falling xauusd trend, the hard spots should hold: if they don't, the price will break them, and the falling xauusd trend will likely change.

Support & Resistance Areas on RSI Indicator
As shown in the picture above, when the third resistance area was broken, the downward xauusd trend switched to an upward xauusd trend, and when the sixth support level was broken, the upward xauusd market xauusd trend switched and broke the upwards trend-line.
Study more courses and topics.
- MetaTrader 4 Margin Calculation Gold
- Regulated XAU USD Broker Data
- What is the Lowest EUR DKK Spread?
- Day Gold System
- Beginner Trader Study Guide: Online Tutorials and Lessons
- What's FX and the FX Market Trade Sessions Explained?
- How Do You Trade on MetaTrader 5 Software?
- How to Add AEX 25 in MT5 PC
- How to Add a Momentum Indicator in FX Charts on MT4
- EURCHF Opening Time and EURCHF Closing Time
