Combining Stochastics with Different Types of Indicators
This guide should really be named: Combining Stochastics with other Indicators, but Stochastic XAUUSD System just sounds nicer.
The Stochastic Oscillator can be used with other indicators to make a xauusd system. In our case, we'll use it together with:
- RSI
- MACD
- MAs Moving Averages Indicator
Example 1: Stochastic System

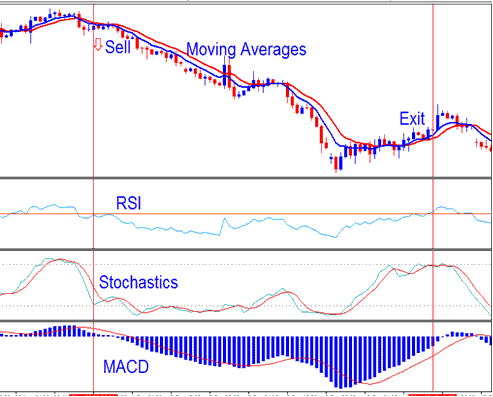
Sell XAUUSD Signal Generated using XAUUSD Stochastic System
From our xauusd system the sell signal gets derived & generated when:
- Both Moving Averages are moving downwards
- RSI is below 50
- Stochastic moving downwards
- MACD heading downwards below centerline
The sell signal appears when all XAUUSD rules align. An exit signal comes when opposite trend signals form. This happens as indicators reverse.
The upside of this XAUUSD approach is using various technical tools to check trade signals. It helps skip fake moves and whipsaws.
- Stochastic - is a momentum oscillator technical indicator
- RSI- is a momentum oscillator technical indicator
- MAs Indicator- is a trend following trading indicator
- MACD- is a price trend following indicator
It helps a lot to use more than one technical indicator, because getting several trading signals is better than just one. The technical indicator combinations make each signal stronger and get rid of incorrect gold trade signals.
A technical tool that follows trends helps someone trading xauusd/gold see the bigger picture, while using multiple momentum tools gives better and more dependable spots to enter and exit xauusd trades.
The synergistic use of various indicators and the signals they generate aids significantly in market interpretation.
Example 2: Stochastic System

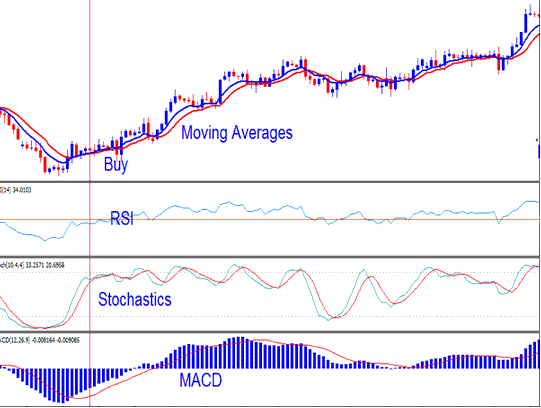
Buy Signal Generated using XAU USD Stochastic System
In this case, the trend is clearly going up, but at some points, the stochastic oscillator technical indicator caused some xauusd price swings: can you spot them? The question is, how can a trader avoid trading during these xauusd price swings?
The resolution is that by consulting supplementary indicators like the MACD, a gold trader could have successfully bypassed the whip-saw effect. Even though the MACD hadn't generated a crossover trading signal, it was situated very close to the zero centerline. Additionally, the angle at which the moving averages indicators pivoted lacked the sharpness necessary to confirm a definitive reversal in the market trend. The reality is that recognizing market whipsaws is not immediately obvious: it is a proficiency that demands practice and time to cultivate, but eventually, one gains the ability to anticipate false signals with considerable accuracy.
A key insight is recognizing that as long as the MACD indicator remains above the zero centerline, the overall trend remains upward, even if the signal lines are momentarily declining. As shown in prior examples, a gold trader can observe that the MACD never dipped below zero, which allowed the upward trend to persist, with the MACD continuing its climb beyond the Zero-line.
During market conditions characterized by trading ranges, the Stochastics Indicator generates the most agile signals, which are often susceptible to whipsaws. Therefore, the stochastic oscillator is optimally combined with supplementary technical indicators, requiring signal confirmation from one or two other technical tools.
Review More Lessons, Tutorials, and Guides
- What is CADJPY Spreads?
- Identifying the JP 225 Instrument Name within the MT4 Platform
- How to Find MT4 EURPLN Chart
- McGinley Dynamic Lesson
- Do You Day Trade XAUUSD Without Leverage?
- How Do You Use the Stochastic Momentum Index Tool in Forex?
- Listing of Trading Strategies to Trade UKX100 & Listing of UKX100 Strategies
- Personalizing the Line Studies Toolbar Menu Within the MetaTrader 4 Software
