MA Support & Resistance Areas
MAs can be used as points of support and resistance on charts.
When the price encounters the moving average (MA), it may serve as a point of support or resistance.
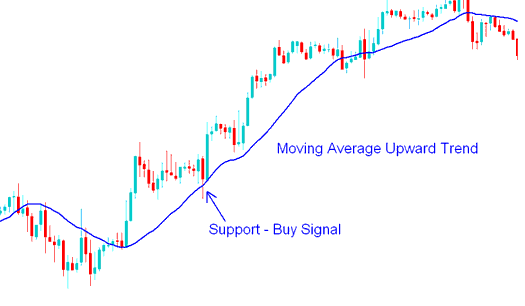
Buy Trading Signal
If prices climb then pull back, traders often wait. They buy at lower points when price hits support. Many use moving averages to spot those support areas.
A buy signal is generated/derived when price hits the Moving Average, turns and starts heading and moving in the upward trend direction. The signal is confirmed when the price closes above the MA Moving Average. Because a lot of traders use the MAs to generate trading signals, price will normally react to these zones.
A stoploss should be set just below where the Moving Average Indicator is. It's best to put it a little bit below the last low point.

Buy Trading Signal - How to Trade with MA Trading Method
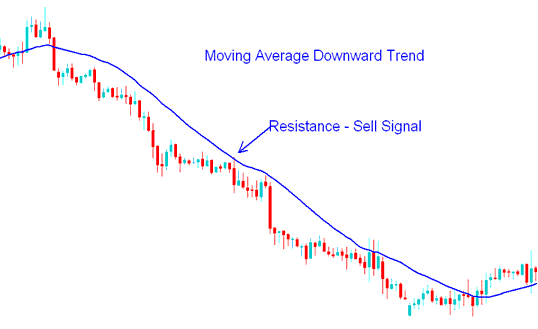
Sell Trading Signal
If the price is going down and starts to go back up, traders might wait to sell at a better price when it reaches a resistance zone. Traders sometimes use the MA to find the resistance zone.
A sell signal is actually confirmed when the market price interacts with the Moving Average (MA), reverses its direction, and begins to move firmly into a downward trajectory. Confirmation of this signal occurs when the price subsequently closes underneath the MA. Because many market participants rely on MAs to generate trading signals, price movements often exhibit a noticeable reaction around these specific levels.
A stop-loss order is ideally positioned slightly beyond the Moving Average trading indicator line. The most appropriate placement is typically a few pips above the preceding peak price.

Sell Signal - How to Trade with Moving Average Strategy
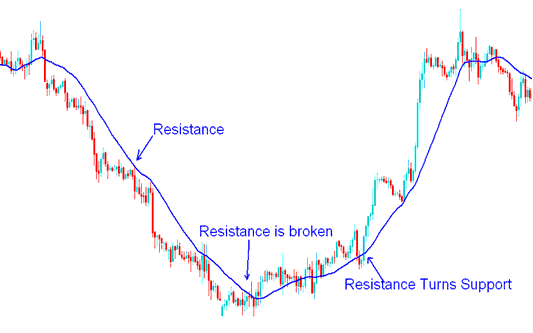
Resistance Area turns Support Area
In Gold - When a resistance level is broken it turns into support and vice versa.
This happens when the fundamentals of a trend change and consequently the direction of a xauusd. Direction change is reflected by the moving average indicator, the direction is confirmed when the resistance zone turns into support level or vice versa (when support area turns into resistance level)

Transformation of a Resistance Level into a Support Level - An Illustration Using the Moving Average Strategy
Learn More Topics and Guides:
- How to Figure Out FX Pip Value for a Cent Forex Account: Explanation
- How to Use MetaTrader 5 Rainbow Charts on the MT5 Platform
- How do you practice trading gold using an XAU/USD practice account?
- How Do I Use MT4 Linear Regression Indicator?
- Daily XAU/USD Trading System
- Kase Peak Oscillator & Kase DevStop 2 Forex Buy Sell Signal
- FX Ehler MESA Adaptive MA EA Setup
