Bollinger Bands Indicator Bulge & Squeeze Analysis
The Trading Bollinger Bands change on their own, which means they get wider or narrower based on how much the price changes.
Standard Deviation acts as a statistical metric quantifying price volatility, which is integral to calculating the expansion or contraction of Bollinger Bands. Standard deviation figures will be higher during periods of significant price movement and lower when prices are more stable.
- When price volatility is high the Bollinger Band widen.
- When price volatility is low the Bollinger Bands narrows.
How to Trade Bollinger Bands Squeeze
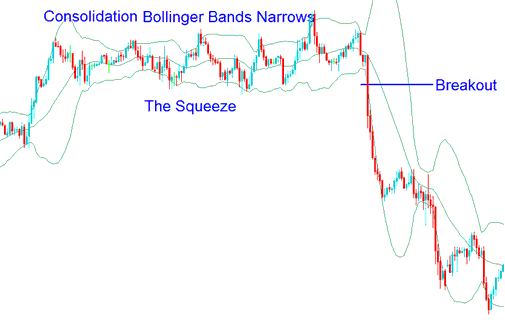
When the Bollinger Bands for xauusd narrow, it indicates price stagnation and is referred to as a Bollinger Band squeeze.
When the Bollinger Band shows small standard deviations, it usually means prices are staying stable, and it is a signal to traders that a big price change is coming, showing they are getting ready for a new move. Also, the longer prices stay within the small bands, the more likely it is that there will be a price change.

Bollinger Squeeze Trade - Bands Tighten for Big Moves
How to Trade Bollinger Bands Bulge
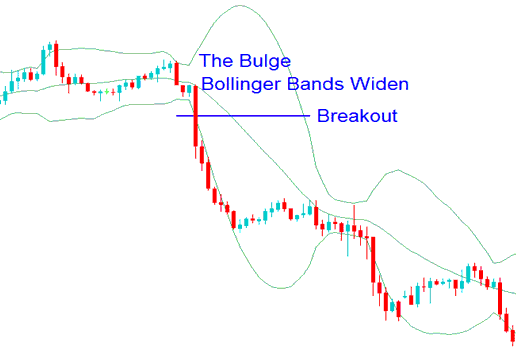
An expansion of Bollinger Bands signals a potential price breakout, referred to as a Bollinger Bands Bulge.
Bollinger Bands that are far apart can serve as a signal that a price trend reversal is approaching. In the Bollinger bands indicator example shown below, the Bollinger bands get very wide as a result of high price volatility on the down swing. The trend reverses as prices reach and get to an extreme level according to statistics & the theory of normal distribution. The "bulge" predicts the change to a downwards trend.

Bollinger Bulge - The Bollinger Expansion - Tips for Trading Bollinger Bands Expansion
Discover More Lessons, Tutorials, and Guides
- Stochastic Momentum Index Expert Advisor Setup
- Example US TEC 100 Indices Trading Strategies Methods Explained
- How Do You Trade S&P 500 Tutorial Course to Trading S&P500 Indices?
- XAU/USD Tutorial
- MetaTrader 4 XAUUSD Margin Level Calculator
- Index Strategy Nikkei
- Overview of Trading Software Options: Desktop Programs, Web Terminals, and Mobile Applications
