MA Strategies
- XAUUSD Price Period of MA
- SMA, EMA, LWMA & SMMA
- Moving Average Trend Identification
- Moving Average Whipsaws in Oscillating Markets
- Moving Average Cross-over Method
- Moving Average Support and Resistance
- How to Select/Choose a MA
- Short-Term and Long-Term Setups
- 20 XAUUSD Pips Price Range Strategy
About the MA Moving Average Strategy
The XAUUSD Moving Average (MA) is highly favored due to its inherent simplicity and ease of operational understanding.
This Indicator is a trend following buying and selling indicator this is utilized by on line buyers for three things:
- Identify the beginning of a new trend
- Measure the sustainability of new market trend
- Identify the ending of a market trend and signal a reversal gold signal
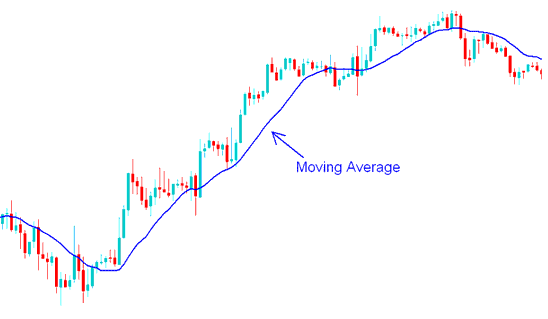
The Moving Average (MA) is utilized to reduce the price action's market volatility. It is an overlay technical indicator displayed on the price chart.
In the chart below, the blue line shows a 15 period MA, which makes the price action's ups and downs less intense.

XAUUSD MA Technical Indicator - MetaTrader 4 Chart Indicators
Calculation of the Moving Average
The moving average, or MA, averages recent prices to track market moves.
Should the Moving Average utilize a span of 10 periods for averaging the trading price, it is then designated as a 10-period moving average. Given that most traders employ the day as the benchmark period for trading prices, we will simply refer to it as the 10-day MA.
To calculate the ten day Moving Average the price of the last 10 days is averaged, the moving average indicator is then updated constantly after every new price period. So after each new price period is formed the moving average is then calculated afresh using the most recent 10 price periods, that's why it's called a moving average(MA) because the average is constantly moving when price info is updated.
Get More Tutorials:
- Intraday Trading Money Management & Risk Management Strategies
- The Main Gold Part of a XAU/USD Plan is Your XAUUSD Program
- Index Bollinger Band System
- An Introduction to FX Strategies for Beginner Traders
- What's DowJones 30 Indices Chart?
- Introduction to FX Pairs & Pairs Symbols
- 1:100 Leverage vs 1:500 Leverage Explained
- Nasdaq Index Strategy Tutorial
- How Do You Analyze/Interpret Trade Price Action Signal?
- Guide on How to Configure a Chart in MT4 Software
