Short Term Moving Averages XAU USD Strategies
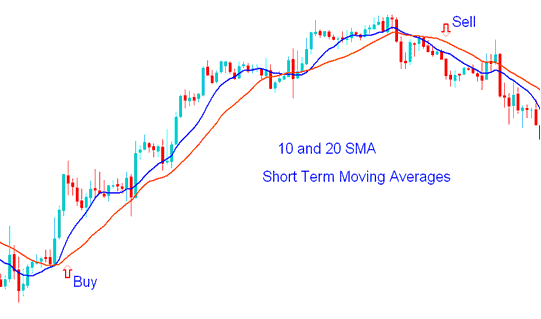
A short-term strategy will employ moving average periods that are shorter, such as the 10 and 20 period moving averages (MA).
In the example below, 10 and 20 simple MAs make signals. They catch trends early.

Short-term with MAs - How to Trade with MAs Examples
Using MAs
Moving averages are one of the most popular tools for analyzing chart trends, especially for scalping and intraday trading.
The purpose of this moving average technical indicator is to enhance analysis prior to making a decision to enter the trading market. Establishing and setting short-term gold trading goals in accordance with the moving average indicator assists a scalper trader in identifying market trends, thereby enabling them to place orders accordingly.
Most signals can come from using a certain price period for the Moving Average Indicator. The Moving Averages price period used will decide whether the buyer will trade quickly or slowly. Also, if the price action is above or below this MA indicator, it shows the market's trend for the day.
If most of the trading market price is below the Moving Average technical indicator, then the day's trend is likely going down. Most traders use the Moving Average as a support or resistance indicator to decide where to trade: if the price touches the Moving Average in the direction of the xauusd market trend, a trade is then made.
Lines showing average XAUUSD movement are drawn, and where they cross the price can help find good times to enter and exit trades. Market trends always go up and down, repeating the pattern of moving and bouncing off the Moving Average, which can signal when to buy or sell.
Simple moving averages are mathematically derived, and their analytical value stems from observing price behavior over a defined time horizon sufficiently long to compute these averages accurately. The interpretation of these lines has furnished numerous xauusd scalpers and intraday traders with essential insights regarding the optimal timing and conditions for initiating xauusd scalping and intraday trading maneuvers.
Medium-Term Method
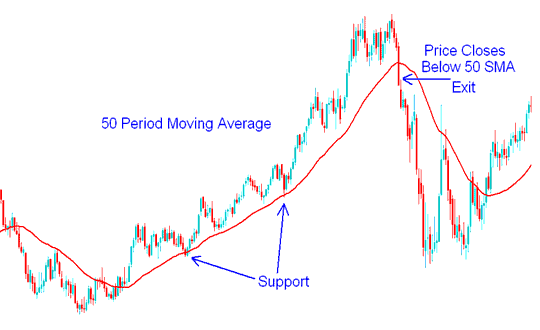
Medium term moving average trading strategy will use the 50 period MA.
The 50 period MA acts as support/resistance zone for the price.
When prices are generally going up, the 50 period MA usually acts as a support, so the price should typically go back up after touching the MA(Moving Average). If the market price ends below the technical indicator, that means it's time to sell.

50 Moving Average Period Support - XAUUSD Method Example
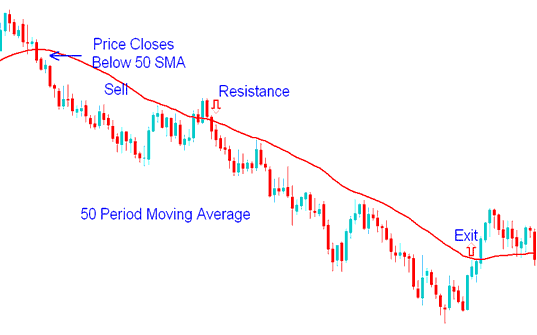
In a downtrend, the 50-period moving average resists price. It drops after a touch. A close above this indicator means time to exit.

50 MA Period Resistance - Strategies Example
50 Day Moving Average(MA) Technical Analysis
When the market shows an upward trend, it is wise to pay attention to an important benchmark - the 50-day moving average of XAUUSD. Continued trading above this average is generally seen as a positive sign. In contrast, if the price falls below this average with significant trading volume, it may be a warning sign, potentially indicating a trend reversal.
A 50-day MA xauusd indicator uses market data from ten weeks and shows the average. The line for the moving average is updated daily, displaying the trend as going up, down, or sideways.
You usually should only buy when prices are higher than their 50-day XAUUSD MA. This tells you the main market direction is going up. You always want to trade with the trend, not against it. Many traders only trade in the direction of the trend.
Prices usually tend to find a level of support at the 50 day xauusd moving average. Large investment firms keep a very close eye on this technical level. When these companies that trade large volumes see a price trend dropping to its 50 day line, they consider it a good chance to increase their holdings, or start a new trade at a good price.
What does it mean if your xauusd moves downward and slices through its 50 day line. If it happens on massive volume, it is a strong signal to sell. This means big institutions are selling their share, & which can cause a dramatic drop, even if fundamentals still look solid. Now, if your xauusd instrument drops slightly below the 50 day line on light volume, monitor how it acts in the following days, & take appropriate action if necessary.
Long Term Strategy
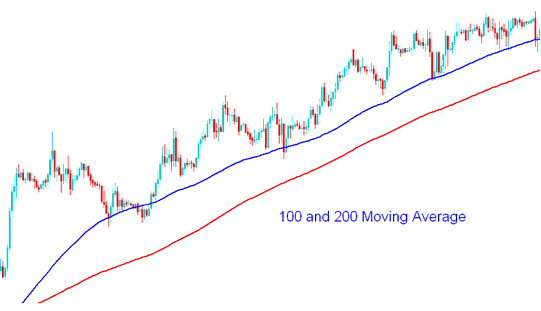
The 100 and 200 MAs, which serve as long-term price support and resistance levels, will be used in the long-term plan, which will make use of extended time periods. Because the 100 and 200 moving averages are widely used by traders, price will frequently respond to these support and resistance areas.

100 and 200 MAs - How to Trade Using MA Strategies
In XAUUSD, traders can use regular analysis and trading analysis together to help decide if buying or selling a xauusd is a good choice.
In the technical analysis method, traders trying to understand how much xauusd is being supplied and demanded use the 200-day moving average to look at data in different ways.
Traders know well the simple way to look at the 200 day MA, which marks where long-term support or resistance is. If the market price is above the 200 day Moving Average, the trend is going up, but if it's below, the trend is going down.
One way to measure supply and demand in XAUUSD is by calculating the average closing price over the last 200 trading sessions. This moving average offers insights into how prices have shifted across a consistent time frame.
The popularity of the 200-day Moving Average in technical analysis can be attributed to its historical effectiveness in producing favorable trading outcomes in the market. A common trading strategy is to purchase when the market remains above this 200-day average and to sell when it falls below this threshold.
With this moving average MA indicator, traders can benefit from being notified when a xauusd instrument rises above, or falls below its 200 day Moving Average and then traders can then use their analysis to help determine if the trade signal is an opportunity to go long or short.
Study More Topics & Lessons:
- What are the Spreads for GBP/CHF?
- What is NKY 225 Pips Size?
- US500 Trading Strategies Tutorial Courses
- How Do You Trade Indices with MAs MAs Moving Averages Example?
- Chaos Fractals Technical Analysis on Trading Charts
- How do you analyze the True Strength Index (TSI) in FX?
- Trading the piercing line candlestick pattern effectively explained.
- What's the Chaikin Money Flow Indicator?
