Bollinger Band Price Action in Trending Markets
Bollinger Bands spot and measure trends. In a trend, they clearly show if it's up or down.
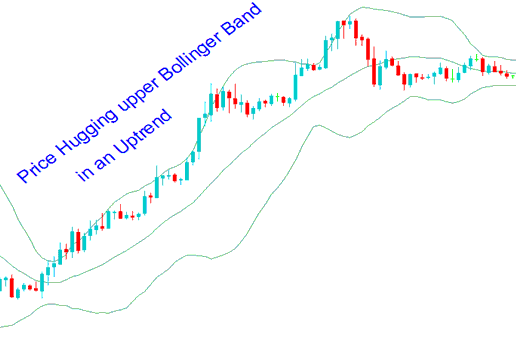
Bollinger Bands help spot trend direction. In an uptrend, the bands point upward. Prices stay above the middle band.
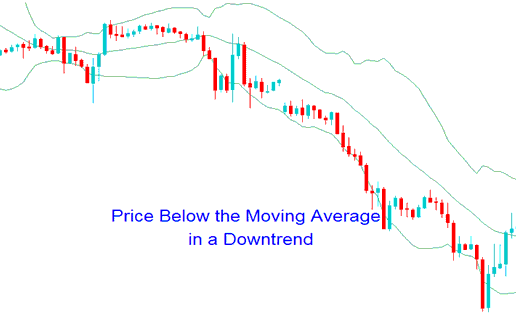
In a downward fashion the charge could be below the middle band the bands could be heading downward.
By analyzing the patterns of the Bollinger band indicator, one can ascertain the likely direction of the market trend.
Bollinger Band Indicator Patterns and Continuation Signals
Upward Trend
- During an upswing, the candlesticks will stay & remain within the upper band the central moving average.
- XAUUSD Prices that close above the upper band are a sign of bullish continuation signal.
- XAUUSD Prices can hug/ride the upper band during an upwards trend

Upwards Trend Method Using Bollinger Bands XAU USD Method
XAUUSD Downward Trend
- During a downwards swing, the candles will stay within the moving average MA & the lower band.
- XAUUSD Prices that close below the lower band are a sign of bearish continuation trading signal.
- XAUUSD Prices can hug/ride the lower band during an downward trend

Downwards Trend Strategy Method Using Bollinger Bands XAU USD Method
More Courses & Guides:
- SPX500 Strategies List and Best SPX Strategies for SPX
- Optimal Times for Trading/Transacting CADCHF GMT
- How Do I Use MetaTrader 5 Trailing StopLoss Levels Indicator?
- Identification of T3 Moving Average (MA) Buy and Sell Trading Signals for Forex
- Overview of US100 Spreads in Index Transactions
- Locating the IBEX Instrument within MetaTrader 4 Software
- Spreadsheet for the 10 Pips Challenge
