Stochastic XAUUSD Indicator Over-bought and Oversold Levels
The stochastic oscillator spots overbought or oversold spots. Overbought is above 80%, and oversold below 20%.
It is crucial to consider not only the Stochastic oscillator technical indicator when the %K or %D lines touch or cross the overbought/oversold thresholds, but also when they cross back through these levels.
Similar to other XAUUSD momentum indicators, such as the RSI indicator, the Stochastic oscillator can remain within the overbought and oversold levels for an extended period. When this XAUUSD stochastic indicator remains in these levels for a prolonged duration, it suggests a strong upward trend (overbought) or a strong downward trend (oversold).
When stochastic lines cross back from overbought or oversold zones, it often signals a trend shift ahead.
A trader may seek additional signals to enhance the reliability of over-sold or over-bought levels if:
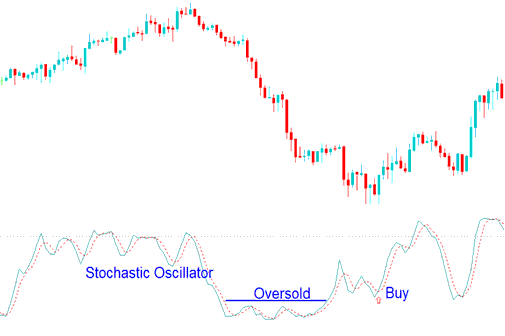
Generating a Buy Trade Signal by Identifying Oversold Levels using the Stochastics Oscillator Indicator
- Before and Prior to Buying, the %K & %D lines turn upward from below 5 %.
- A reading that is floating near 5% means that xauusd bears are in control and there is selling of the xauusd. A trader should wait out for the Stochastic Indicator to move back above 5% as a sign that selling pressure is easing.
Confirmation of a Buy signal occurs once the stochastic oscillator technical indicator moves out of the oversold region and subsequently returns to oversold territory, only to immediately turn upwards again without lingering in the oversold zone.

Buy Trade Signal Using Stochastics Oscillator Oversold Levels
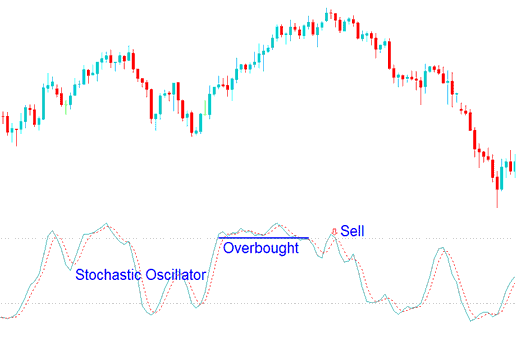
Sell XAU/USD Signal Using Stochastics Oscillator Indicator Overbought Levels
- Before and Prior to Selling, the %K and %D lines turn downwards from above 95 %.
- A reading that is floating above 95% means that xauusd bulls are in control and there is buying of the xauusd. One should wait out for the Stochastic to move below 95% as a sign that buying pressure is easing.
- The sell signal gets to be confirmed when stochastic indicator moves below overbought, then after a while returns to overbought but this times moves downward immediately without staying at the over-bought.

Sell Gold Signal Using Stochastics Indicator Trading Overbought Levels
Check various chart times with overbought and oversold levels. This aids in picking the right entry for a trade.
The main idea is to trade in the same direction as the trend. Always check signals against longer-term stochastic indicators to confirm signals on shorter timeframes.
More Topics and Tutorials:
- Piercing Line FX Candle Pattern vs Dark Cloud Cover Pattern Meaning
- Setting Up Relative Vigor Index Expert Advisor
- Specific Trading Hours for EURCHF Opening and Closing
- A Trading System Developed for the UKX100 Stock Index
- NETH 25 Indicator MetaTrader 4 Indicators
- How to Place Accelerator Oscillator on Gold Chart on the MT4
- How Do You Use MT5 Keltner Bands Trading Indicator on MT5 Platform?
- A Step-by-Step Explanation of How to Open a Chart in MetaTrader 4 Software
- Index Spreads: What They Are and How They Work
- Stochastic Momentum Index Expert Advisor Setup
