Continuation BTCUSD Trading Patterns
When these continuation bitcoin trading chart patterns are formed they confirm that the current bitcoin trend is going to continue moving in same direction.
These patterns are used by cryptocurrency traders to identify half way points of the trend, this is because they form at the half way point of a trend.
There are four types:
- Ascending triangle
- Descending triangle
- Bull flag/pennant
- Bear flag/pennant
Ascending Triangle
The ascending triangle is formed in an up bitcoin trend and it shows that the upward direction of the market is going to continue.
It shows that there is a resistance level that the buyers keep pushing each time moving it higher, and once it breaks bitcoin price will continue heading upwards.
Overhead resistance temporarily prevents the btcusd trading market from advancing higher, while the rising bitcoin trend line beneath the pattern signals that buyers are still present. An upside penetration of the upper line is a technical buy cryptocurrency signal for a market breaking out from an ascending triangle.
Found within a Bitcoin upward bitcoin trend, the ascending triangle forms as a consolidation period within the up bitcoin trend and indicates upside continuation will follow.
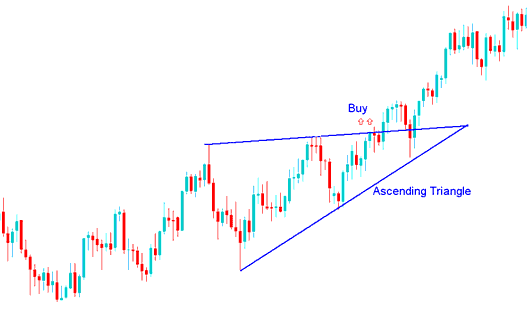
The market formed an ascending triangle during its up bitcoin trend which led to upside continuation. Buy point is when bitcoin trading price clears the upper sloping line & the btcusd market continues heading upwards.
Descending Triangle
The descending triangle is formed in a down bitcoin trend & it shows that the downwards direction of bitcoin trading price movement is going to continue.
It shows that there is a support level that the sellers keep pushing each time moving it lower, and once it breaks bitcoin trading price will continue to move downward.
The support temporarily prevents the btcusd trading market from declining, while the descending sloping line above the pattern signals that the sellers are still present. A down-side penetration of the lower line is a technical sell cryptocurrency signal for a market breaking down from a descending triangle, & it indicates selling will follow.
Found within a Cryptocurrency downward bitcoin trend, the descending triangle forms as a consolidation period within the down bitcoin trend & indicates downside continuation will follow.
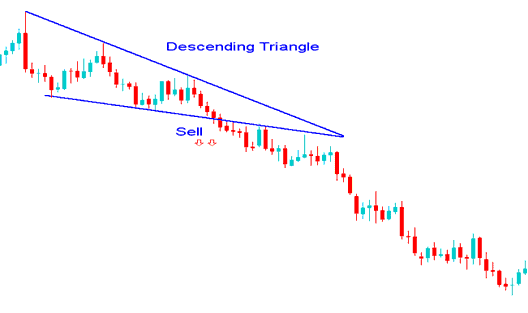
Market formed a descending triangle during its down bitcoin trend which led to further selling & continuation of the downwards cryptocurrency trend. The technical sell cryptocurrency signal is when bitcoin trading price breaks-out the lower horizontal sloping line as selling resumes to push the btcusd trading market lower.
Bull Flag/Pennant
This bitcoin pattern forms what looks like a rectangle. The rectangle is formed by two parallel lines that act as support & resistance for the bitcoin trading price until the bitcoin price breaks out. In general, the flag will not be formed perfectly flat but it will be formed sloping.
The bull flag is found within a Bitcoin upward cryptocurrency trend. In this continuation pattern where the btcusd market retraces slightly, it is therefore a slight retracement with narrow bitcoin trading price action that has a slight downwards tilt. The technical buy point is when bitcoin trading price penetrates the upper line of the flag. The flag portion has highs and lows which can be connected by small lines which are parallel, giving it what looks like a small channel.
The pennant occurs at halfway point of a bullish upward bitcoin trend & after a break out a similar move equivalent to the height of the flagpole is expected.
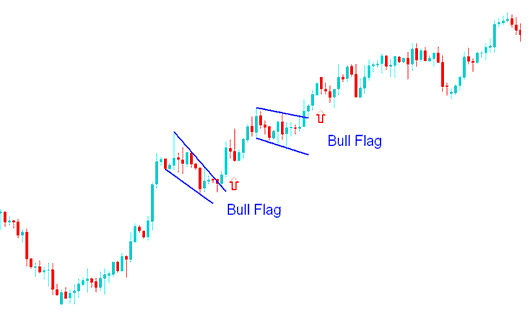
The bull pennant above was just a resting period as the btcusd trading market gathered strength to break out & move higher. The continuation trading signal was confirmed as a upper line was broken to the upside.
Bear Flag/Pennant
This flag is found in a Bitcoin downward cryptocurrency trend. The bear flag is a continuation pattern where the bitcoin trading price retraces slightly with a narrow bitcoin trading price action that has a slight upward tilt. The technical sell point is when bitcoin trading price penetrates the lower line of the inverted flag. The pennant portion has highs and lows which can be connected by small lines which are parallel, giving it what looks like a small channel.
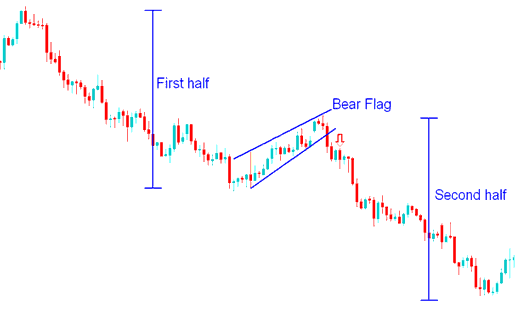
The bear pennant above was just a resting period for the btcusd trading market prior to more selling. Continuation signal was confirmed as the lower line was broken to the down-side.


