BTCUSD Trading Fib Expansion Levels
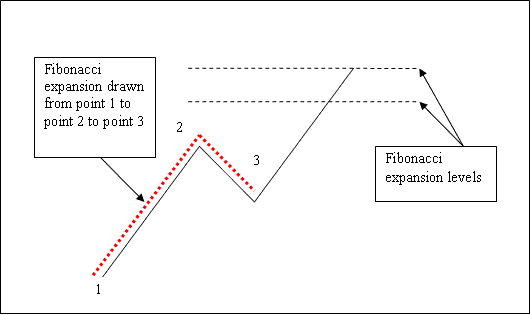
In the last lesson, we covered Fibonacci retracement, which you draw between two points. For Fibonacci expansion, you need three points.
We draw these levels after the pullback ends. The price then resumes the main Bitcoin trend. The pullback's end point serves as point 3.
The example illustrated below shows the 3 Points where the Fib extension is drawn, marked and labeled as 1, 2 and 3. 1 is where the btcusd trend started, 2 is where the bitcoin trend pulled back and retraced & 3 is where the market retracement reached like as shown in the illustration shown below.

Pay attention to where these technical levels show up - they're drawn above the trading indicator. These are the spots where you'll want to set your take profit orders.
Drawing Expansion Levels on an Upwards Trend
We use Fibo extension levels to guess where the price will go. Two levels are important: 61.80% and 100%. These are used to take your profit.
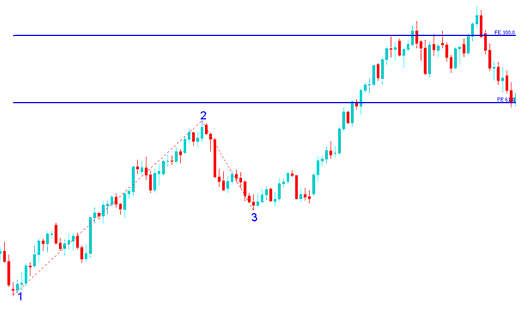
In the example below, you can see the Fibonacci extension drawn along the price trend direction. Since the Bitcoin trend is upward, the extension follows this movement.
These levels are shown as lines that go across the top of the indicator, showing where to take your profits. In the example shown here, if you had used a 100% extension, you would have made a good profit from the trade.
Reminder: This is the same transaction as in the last example, where we employed Fib retracement to purchase at the 38. 2% retracement mark. We have simultaneously set our take profit entirely utilizing Fibonacci extension. Now try out these techniques on a Bitcoin chart.

The illustrations displayed above indicate that the upward trend of bitcoin persisted, with both the 61.8% and 100.0% levels being reached, after which the bitcoin price retraced following the attainment of the 100.0% extension.
Drawing Expansion Areas on a Downward Trend
Considering we employ this instrument to estimate target (tp) orders, how does one chart it during a declining Bitcoin trend?
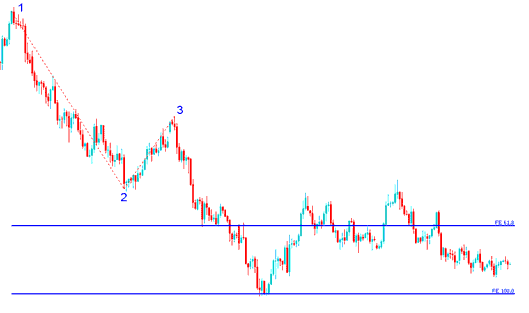
We draw it from point 1 to 2 to 3 as shown below. Always remember that we draw this tool in the direction of the trend. In the example shown below, can you tell in which direction we have drawn it? That's right - downwards.
Look at the difference between how we drew it before and how it's drawn now. This time, you'll have used the 100% extension level: see where the bitcoin price went. That would have been a good place to take profit.

Based on the preceding visual depiction, after this particular tool has been drawn, two specific levels are designated to indicate where profit-taking decisions should be made: these are represented by horizontal lines spanning across the Bitcoin price chart.
More Lessons and Tutorials & Courses:
