Bitcoin Price Action Method 1-2-3 in the Bitcoin Trading Market
Bitcoin Price Action denotes trading Bitcoin using solely chart analysis, foregoing the application of technical indicators plotted on the chart. Candlestick charts are utilized exclusively when employing this approach. This particular trading approach relies on geometric lines and pre-established formations, such as the 1-2-3 pattern, which develops through a sequence of bars or as a distinct pattern.
Traders opt for this strategy because it is highly objective, allowing one to analyze and interpret movements in the btcusd trading market strictly based on visual chart analysis and market movement insights.
This approach is utilized by a multitude of traders: even those employing technical analysis tools often incorporate some aspect of bitcoin's price action into their methods.
The optimal application of this approach occurs when the signals produced are paired with line tools to give additional validation. Such line tools can be bitcoin trend lines, Fibonacci retracement levels, and support or resistance zones.
Bitcoin Price Action 1 2 3 Breakout
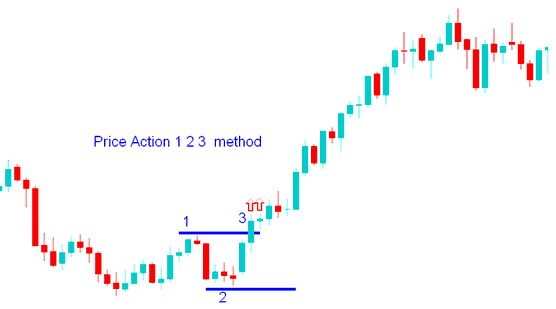
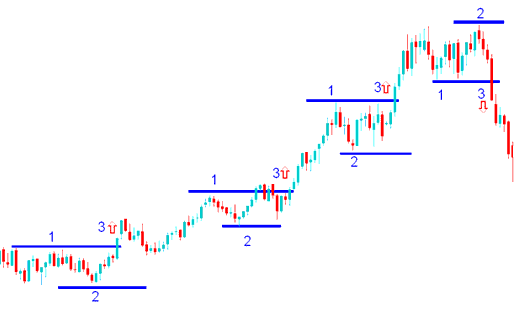
This trading strategy uses three chart points to identify the break out direction of bitcoin crypto. 1-2-3 technique uses a peak & a trough, these points forms point 1 & point 2, if the market crosses above the peak the signal is to go long, if it falls below the trough the trading signal is to go short. Breakout of point 1 or point 2 it it forms the third point.

Series of breakouts on Bitcoin Chart

Investors study Bitcoin price action to guess trend direction. Markets either trend or stay in ranges.
A market exhibiting a trend moves predominantly in one direction, whereas a market that is range-bound moves horizontally, often after reaching either a support or resistance boundary.
Watching how the bitcoin price changes tells us if the btcusd market is trending, ranging, or changing direction.
As with any other Bitcoin strategy this method should also be combined with other confirming indicators to avoid whipsaw signals. The 1-2-3 pattern formation can give good trading signals in a trending market but will give whipsaws when the btcusd trading market is range-bound, it is better to identify if the btcusd trading market is trending or not before you begin using this strategy.
Combining Together This Strategy with other Indicators
Excellent factors to combine with are:
- RSI
- Moving Average Technical Indicator
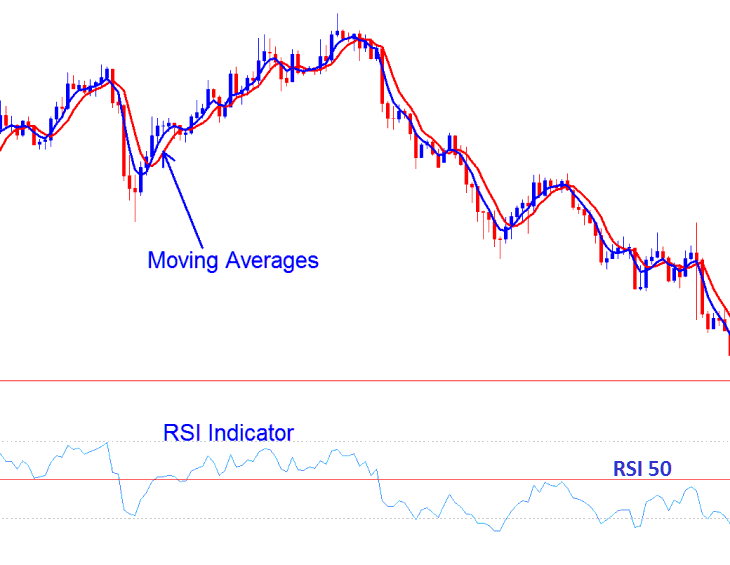
Investors should check these two signs to make sure the breakout direction matches the bitcoin trend shown by these two signs. If the direction matches what these trading signs show, then traders can start a trade in the same direction as the signal. If not, investors should not trade because the signal is more likely a bitcoin fakeout.
Just like any other indicator in BTCUSD CryptoCurrency Trading, bitcoin price action also has whipsaws and there's a requirement to use this trading strategy as a combination together with other trading signal as opposed to just using this trading strategy alone.

Combining with other Indicators - RSI & MAs
Study additional tutorials and courses at.
- BTC USD What's Straight Through Processing BTC/USD Account Meaning?
- MAs Moving Averages Short Term MAs BTC USD Trading Indicator Strategy
- How to Open MT5 Practice BTC USD Trade Account
- How to Read Trade Candlestick Patterns for Trading?
- How to Analyze Different Types of BTC USD Trends in BTC USD Trade
- Stochastic Indicator Divergence Setup BTC USD Strategies
- How Do I Interpret a Upwards Trend Signals in Trade?
- How to Register Practice Account in MT4 Trade Platform
- Analysis of the Keltner Bands Indicator Applied to BTC/USD Charts
- Which is the Best BTC USD Chart for BTCUSD Trade?
