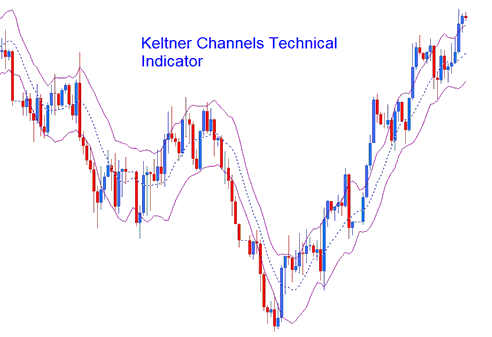
Keltner Bands Bitcoin Analysis & Keltner Bands Trade Signals
Created by Chester Keltner in His Book on Commodity Trading Profits
Keltner Bands, derived from the Average True Range (ATR) indicator, utilize ATR values to delineate the bands.
These Bands serve to construct Channels, which aid in identifying prevailing Bitcoin market trends using this straightforward volatility channel mechanism.

Keltner Channels
Construction
Keltner Channels are a lot like Bollinger Bands, but Bollinger Bands use standard deviations to determine how unsteady the market is and to draw the bands on the chart.
Keltner channels use ATR, not deviations. ATR measures price swings.
This btcusd indicator is a moving average that uses the closing bitcoin price over a number of periods. These channels are made by
Adding (for the top line) and
Taking Away (for the bottom line)
An (n period simple moving average of an n-period ATR) * an ATR multiplier.
BTCUSD Analysis & Generating Signals
This btcusd indicator can be transacted in much the same way as a Bollinger Bands
Continuation Signals
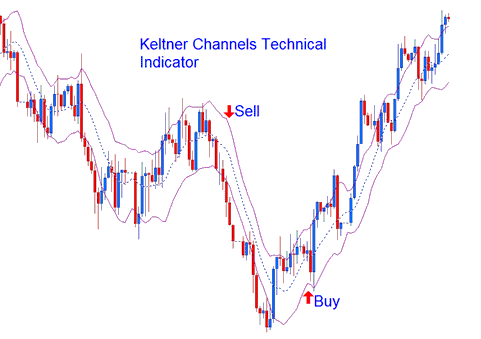
If Bitcoin price goes beyond the bands, the ongoing trend in Bitcoin will keep going. A signal to buy crypto comes when channels rise. A signal to sell appears when channels drop.

Continuation Buy & Sell Trading Signals
Reversal Bitcoin Signals - Double Top & Double Bottoms
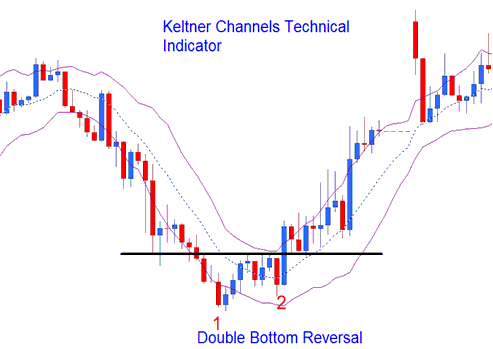
Tops and bottoms outside Keltner channels, followed by ones inside, signal trend reversals in BTCUSD.

Reversal Signals
Ranging Bitcoin Markets
When prices stay within a range, a move from one Keltner channel will usually go all the way to the opposite channel.
Examine More Overviews & Educations:
- How Do I Analyze in BTC USD Trade Where to Place Stop Loss BTC USD Order using BTC/USD Trend Lines?
- How Do I Identify a Bear Flag BTC/USD Pattern in BTC USD Trade?
- How Do You Trade BTC USD & Open a Live MT5 Bitcoin Account in MT5 Platform?
- How to Use TakeProfit BTC USD Trade Order on MT5 Platform
- How Do I Learn How to Use Demo BTC USD Trade Account?
- How to Analyze Trend Buy and Sell Trading Signals in Trade
- Complimentary BTC USD Indicators for Buy and Sell Trading Signals
- Guide to BTCUSD Indicators on Android in MetaTrader 4
- Bollinger Band Width Bitcoin Indicator Analysis in BTC USD Trade
- Where Can I Find BTC USD Trade Analysis Sites?
