Hidden Bullish and Bearish Divergence in Bitcoin Trading
Hidden divergence is used as a possible signal for a bitcoin trend continuation after the bitcoin price has retraced. It's a trading signal that the original bitcoin trend is resuming. This is best setup to trade because it's on same direction as that one of the continuing price trend.
Bitcoin Hidden Bullish Divergence
This happens when the bitcoin price makes a higher low (HL), but the oscillator tool shows a lower low (LL). To easily remember these setups, think of them as W-shapes on chart patterns. It happens when there is a pullback in a rising BTC/USD trend.
The example here shows a screenshot of a btcusd crypto setup. In the picture, the bitcoin price goes to a higher low (HL), but the trading indicator goes to a lower low (LL). This shows that the bitcoin price and the indicator were giving different signals. This signal means that the btcusd cryptocurrency market's upward movement is likely to start again soon. It indicates that this was simply a short pause in a bitcoin uptrend.
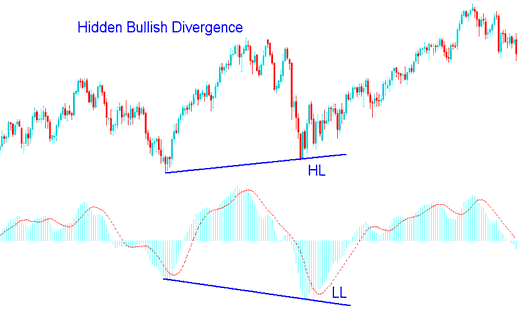
This says that a price pullback is done and points to energy behind a cryptocurrency price going up.
BTCUSD Hidden Bearish Divergence
This happens when the bitcoin price makes a lower high (LH), but the oscillator tool shows a higher high (HH). To easily remember this, think of it as M-shapes on the chart. It happens when the price goes back up a bit in a Bitcoin downtrend.
The screenshot below shows a bitcoin setup. The price hit a lower high, but the indicator reached a higher high. This shows a split between price and indicator. It means the downward bitcoin trend will pick up again soon. In simple terms, it was just a pullback in a down move.
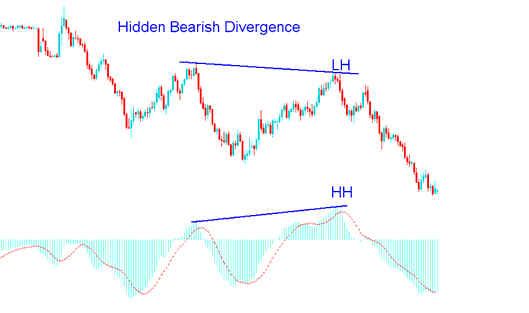
This says a pullback is done & shows the energy behind a cryptocurrency price moving in a downward direction.
Other well-known indicators used include Commodity Channel Index (Commodity Channel Index Indicator), Stochastic Oscillator, RSI & MACD. MACD and RSI stand out as the top indicators to look at.
NB: Hidden divergence pattern is the best type divergence pattern to trade because it gives a trading signal that is in the same direction with the current trend, thus the setup has a high risk to reward ratio. This setup provides for the best possible entry.
However, a bitcoin trader should combine this cryptocurrency trading setup with another indicator like the stochastic oscillator or moving average & buy when bitcoin is oversold, & sell when bitcoin is overbought.
How to combine hidden divergence with moving average crossover strategy.
Combining these various bitcoin trading setups is best achieved by utilizing the moving average indicator with the crossover technique, resulting in a robust trading strategy.
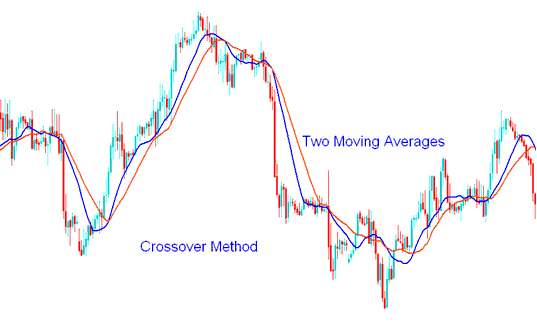
Moving Average Cross-over Method
Using this approach, a trader will await a buy/sell cryptocurrency trading signal generated by the moving average crossover method that aligns with the prevailing trend direction *after* the initial signal occurs. If the bitcoin price and technical indicator display a bullish divergence, the trader will wait for the moving average crossover strategy to signal an upward cross: conversely, for a bearish setup, the trader will hold for the moving average crossover technique to generate a downward bearish crossover signal.
Pair this crypto signal with other tools. Traders dodge false moves in bitcoin trades.
Combining Together with Bitcoin Fibonacci Retracement Levels
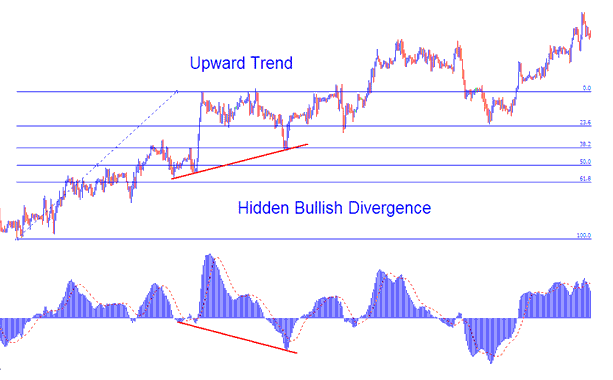
For this illustration, we will consider an upward trend and utilize the MACD indicator.
Hidden divergence acts as a pullback in an upward bitcoin trend. Pair this crypto signal with Fibonacci retracement zones, a popular pullback tool. The example below shows the setup on the chart as bitcoin price touched the 38.2% level. That test point made a strong buy entry spot.
Combining with Bitcoin Fibo Extension Levels
In the preceding cryptocurrency trading scenario, after placing the buy bitcoin trade, a btc/usd trader needs to calculate the precise location for setting the take profit order. To achieve this, the Bitcoin trader must employ the Bitcoin Fibo Expansion Levels.
The Fibonacci extension tool was projected onto the BTCUSD price chart exactly as depicted and visually demonstrated in the following section.
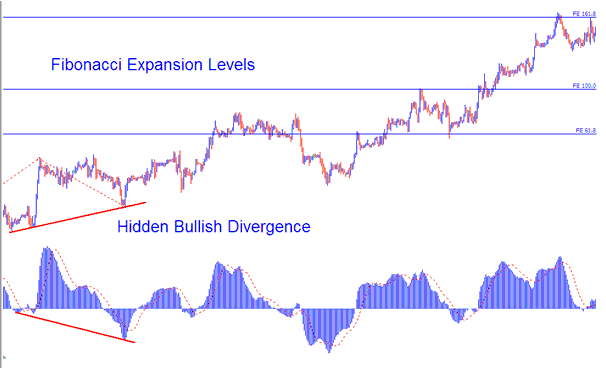
For this exemplification there were three tp order areas:
Expansion Level 61.80% - 131 pips profit
Extension Level 100.00% - 212 pips profit
Extension Level 161.80% - 337 pips profit
Pair this strategy with Fibonacci levels. It creates solid setups. Use those take-profit spots for good gains.
Get More Topics:
- Key Concepts and Tutorial Training Courses for Learning Trade Fundamentals
- Placing a Trade Take-Profit Order Utilizing MT4 Software Capabilities
- Techniques for Analyzing and Interpreting Trading Charts on the MT4 Platform
- Drawing an Upward Channel on MT4 Charts Explained
- Installation Guide for BTC/USD on the MetaTrader 4 Platform
- BTCUSD Stop Loss Order Example
