Momentum Bitcoin Trends
What is a Momentum Trend?
A momentum bitcoin trend is one that has more momentum than previous one, it can be portrayed using a much steeper bitcoin trend line than the one that was in play before. When a new line forms that's much steeper than a earlier one we say that the bitcoin trend has gained more strength and becomes much stronger. These types of set-ups require a different type of analysis.
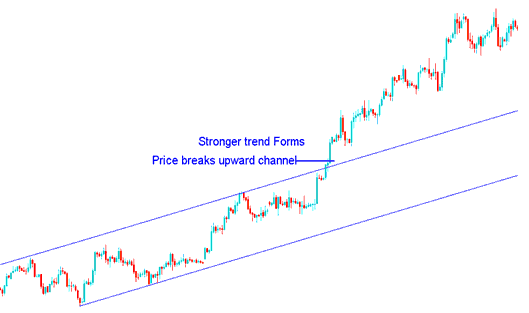
In the cryptocurrency example below: Also, when the price of bitcoin goes up inside a channel, breaking out of that channel means a stronger upward trend is starting, as shown below. If your chart shows the price of bitcoin breaking above an upward trend line in a rising market, do not sell: instead, buy more. Remember this tip: it can make you a lot of money, like in the analysis below.

Channel Break Upward - More Momentum on Upward Market Movement
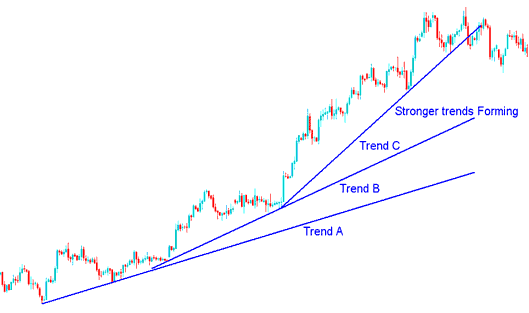
Using the same technical analysis example as before, we can also see how new, steeper trendlines formed, which shows that the bitcoin trend was picking up speed.
This is visually evidenced by the trend lines exhibiting a steeper incline, which can be charted as the price of Bitcoin moves forward.
The new Bitcoin trend builds speed faster than the old one. The sharp trendline setup proves it.
This makes bitcoin trends B and C, as you can see in the picture made using the MT4 technical analysis tool, and the momentum made the line steeper on the chart.
This is shown in the crypto example below by lines A, B, and C, which show stronger trends forming as the btcusd market keeps gaining speed.

Bitcoin Price Gathering More Momentum
Nonetheless, if the sharpest bitcoin trend line is violated, it is likely that other trend lines will also be broken. It is wise to take profits as soon as the steepest trend line fails.
This method can also be used by bitcoin traders who trade for a short time, like day, intra-day, or scalper traders: this pattern often shows up on the 5 and 15-minute charts. These lines showing a quick rise can tell you when to take your profits. A trader should quickly secure their profit when the steepest line is broken.
How to Trade These
The momentum bitcoin trendlines are useful tools for trading analysis to help you know where to take profits early before other traders do. This momentum pattern often appears on 1-minute, 5-minute, and 15-minute trading charts, making it good for scalpers and day traders. For day-to-day trading, which happens most often, the best trading chart to use is the 15-minute one, and sometimes the 5-minute one. For example, after you start a short-term trade, either buying or selling, and the btcusd market moves a few pips in your favor, if you see this pattern, it's best to leave the trade when the steepest trend line breaks and take your profit then.
Analysis Examples
For this example, we use a short-term minute chart. When the pattern formed, it was time to take profits.

the Momentum Market Moves
In the aforementioned example, a trader would have waited for the steepest trend line to be breached before closing the trade and securing a profit of 42 pips on this buy bitcoin transaction. The trader would have exited the trade at the optimal moment, thereby avoiding the subsequent ranging market.
What is it?
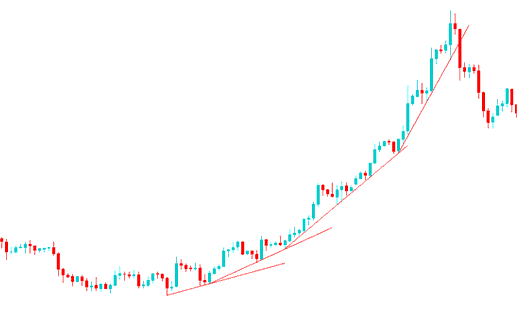
Occasionally, the market exhibits a parabolic behavior, which is evident during moments of frantic buying that cause bitcoin prices to surge sharply. During such a rapid ascent, there is nearly no presence of sellers, creating a buying vacuum. In these situations, traders rush to enter the btcusd market without hesitation regarding the price, driven by the fear of missing out. This phenomenon can generate significant price fluctuations in bitcoin over a very short period, prompting traders to place buy orders in this particular trading scenario.
For this sort of move it's far satisfactory to maintain buying - no want for technical evaluation simply hold shopping for.
This bitcoin trend can last for months or even two years: just keep buying, and as long as those weekly and monthly bitcoin lines hold, keep buying.
When bitcoin changes like this, the highest price it reaches often means the move is ending, and bitcoin prices may not reach those high points again for quite a while. When this happens & the steepest bitcoin trendline is broken, it's smart to think that the bitcoin trend is changing, and it's best to step away from the btcusd market & enjoy your profits before planning what to do next.
The same thing can occur for a dropping bitcoin trend with panic selling, driving bitcoin price straight down, mainly during a recession period.
Sharp Bitcoin trendline slopes make it less solid. Leave the trade if the steepest breaks. The oil example below starts a parabolic run. Bitcoin mirrors it on weekly or monthly charts. This hit right after oil's line failed.

If you see a bitcoin price going up very fast, as a trader, just keep buying more, and you will probably earn money from this upward trend, and you don't need extra study, just watch the trend lines. Remember to sell when the line going up very fast breaks because the change in direction of this cryptocurrency happens quickly, so you must also act fast. Be sure, as a trader, to sell at the right time, like in the example above.
More Topics & Courses:
- How to Interpret and Analyze in BTC USD Where to Place a Stop Loss BTC USD Order
- BTC USD Online Trade MT5 iPad App Guide Tutorial
- How Do I Draw BTC USD Channels in MT4 Platform/Software?
- Check 61.8% Fibonacci Retracement on BTC/USD Charts
- Which is the Best Trading Indicator for BTCUSD Trade?
- How to Add Trading Parabolic SAR Technical Indicator in Trade Chart
- Where Can I Acquire BTC USD Trading Analysis Knowledge for Beginners?
- How Do I Analyze a Upwards Trend Signals in Trade?
- MACD Buy & Sell BTC/USD Signals Generation BTC USD Strategies
- How to Open BTC USD Trade
