MT4 Bar Charts
A Bitcoin chart shows how a bitcoin tool's price changes over time with a visual image on a graph for a set amount of time.
Plotted on a grid format, the user retains the autonomy to select their preferred cryptocurrency timeframe for trading, whether that involves hourly cryptocurrency charts, daily charts, or even ultrashort 1-minute crypto timeframes.
There are three ways to make cryptocurrency charts. The ways used to make the charts define the kind of bitcoin chart it is.
Three Crypto Chart Types: Candlestick Charts, Bar Charts, Line Bitcoin Charts
- Line charts
- Bar charts
- Candles crypto charts - Most popular
Line BTCUSD Chart
A solitary line is constructed by connecting one preceding BTCUSD closing price point to the subsequent one, thereby forming an uninterrupted linear representation.
This chart gives very little information, so most investors don't like it. This kind of bitcoin chart is almost never used.
Line Bitcoin Chart in Bitcoin - This charting format omits vital details concerning Bitcoin's price evolution, specifically neglecting the opening, high, and low points of the price action from the visual representation.
This type of crypto line chart seems rough to technical analysts in cryptocurrency trading.
The chart below displays example of a line bitcoin chart.

Bar Bitcoin Crypto Currency Chart
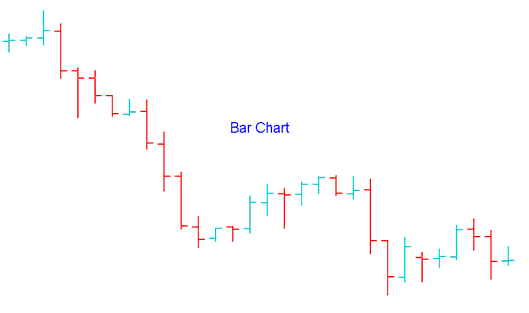
Bar charts display open, close, high, and low for bitcoin intervals. Vertical bars mark these levels. That's how they got the name bar charts.
- Bar Charts - bar chart has got a vertical bar showing the total bitcoin price movement.
- Left horizontal bar the opening
- Right horizontal bar the closing
- High and low denoted by highest & lowest point
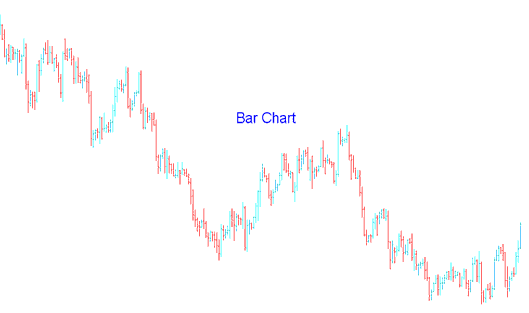
However, these bitcoin trading bar crypto charts aren't very easy to work with, especially when they aren't magnified. It becomes very difficult to interpret the bar crypto charts with ease when trading the btcusd market thus making them not popular among traders and investors.

A zoomed-out bar chart hides open and close Bitcoin prices. See the example.
Candle BTCUSD Crypto Chart
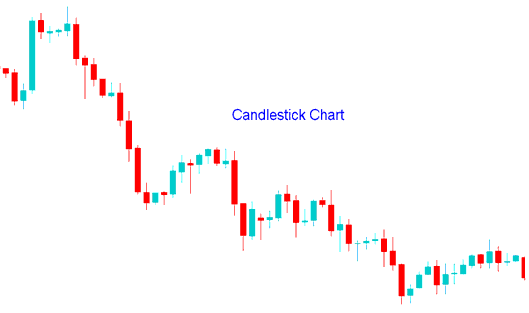
Candle Charts - This is the most frequently utilized type of chart, resembling candles, hence the name - candlestick bitcoin charts.
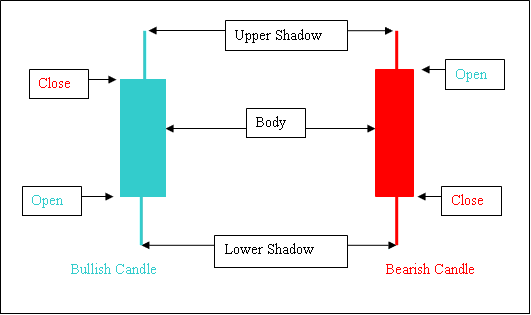
Candlestick charts display open, close, high, and low for each BTCUSD interval.
The difference between the opening bitcoin price and the closing bitcoin price is referred to as the body of the candlestick.
Bitcoin candles crypto charts are the most well-known and liked crypto charts among online bitcoin traders because they are the easiest to understand when trading the btcusd market. Bitcoin candlestick charts also give a lot of details about how the bitcoin price moves. This makes crypto candles charts the most popular type of chart in BTCUSD.
Candles BTC/USD Crypto Charts
Shown Below is an example of candles charts. To learn and know more about crypto candlesticks charts, study this lesson: Technical Analysis of Japanese Bitcoin Candlesticks Setups in Bitcoin Trading.
How to Pick Bitcoin Chart Types on the MT4 Platform?
To draw any type of crypto chart in MT4, just use the buttons below on the MT4 platform.
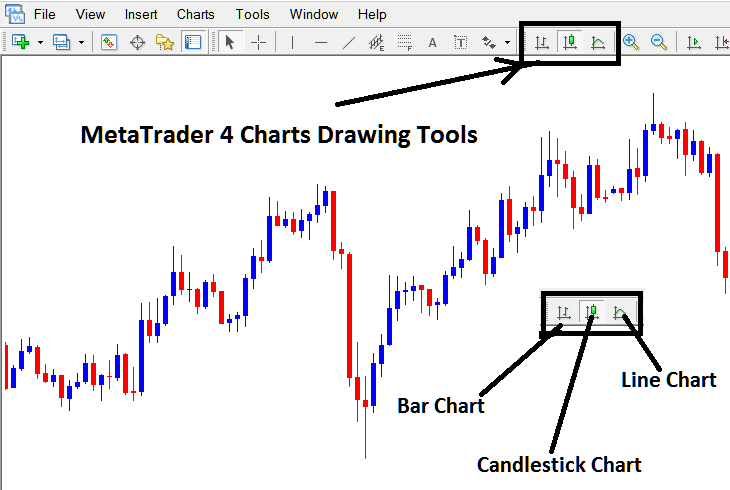
Drawing Bitcoin Charts on MT4 Software
- To Select a Bar BTCUSD Chart Click the Bar Button
- To Choose a Candlesticks Bitcoin Chart Click the Candle Button
- To Choose a Line Charts - Press the Line Button
Learn More Courses & Topics:
- Comprehensive Guide to Chart Analysis and Interpretation for BTC/USD Trading
- What Types of Bitcoin Trading Exist?
- How to Start BTC USD Trading on MetaTrader 4 Android BTC USD App
- Steps to Draw Intraday BTC/USD Trading Trendlines
- Different Bitcoin Trading Accounts: What You Need to Know
- How Do You Set Up MT4 BTCUSD Program Installation?
- Instructions: How to Set a Trade Take-Profit Order within the MT4 Software
- How to Trade and Draw a Trendline on a Chart
- Analysis of the Chandes Dynamic Momentum Index Indicator Applied to Bitcoin Charts
- Steps to Draw a Downward Trend-line on the MetaTrader 5 Software
