Drawing Fibo Retracement Areas on Upwards & Downward Trend
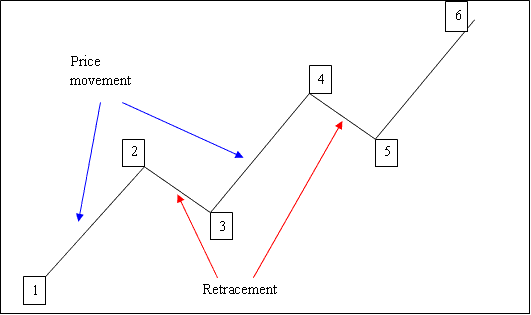
The bitcoin price on a cryptocurrency chart does not move up/down in a straight line. Instead it heads upwards or downwards in a zigzag manner. Fibo Retracement is the tool used to calculate/estimate where the zigzag will stop. The pull back levels are 38.2 %, 50 % & 61.8%. These form the points at which the btcusd market is likely to make a retracement.
A retracement pulls the bitcoin price back before the BTCUSD market returns to its main trend direction.
Zigzag Price Examples - Bitcoin Price Rising in Zigzag Pattern
The diagram below shows movement in an upward market.

1-2: Bitcoin Price moves up
2-3: Pull back
3-4: Moves up
4-5: Pull-back
5-6: Moves up
Given that we can pinpoint where a pullback begins on a crypto chart, how can we ascertain where it will end?
The answer is we use Fib retracement tool indicator.
This line study technique is employed in Bitcoin trading to forecast and assess these levels. The BTC/USD indicator is applied directly to the cryptocurrency chart on the trading platform provided by the broker, automatically calculating these levels.
What are The Retracement Levels
- 23.6%
- 38.2 %
- 50.0%
- 61.8 %
Traders often use the 38.2% and 50% levels most. Prices tend to pull back to these spots. The 38.2% level gets the most attention.
The 61.80% level is frequently selected as a reference point for setting stop-loss levels on trades initiated using this particular strategy.
This tool will be oriented in accordance with the trend as illustrated in the examples provided below.
How to Draw on an Upwards Bullish Market
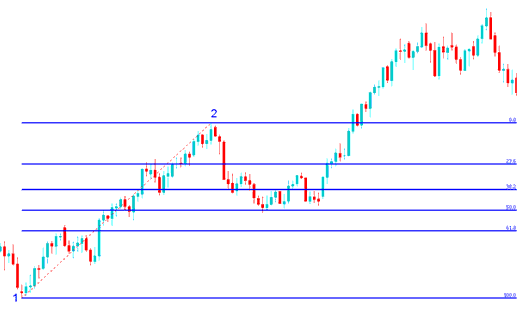
In the diagram below the bitcoin price is heading up between 1 and 2 then after 2 it retraces downward to 50.00% pull back area then it continues heading upward in the initial upward trend. Notice that this trading indicator is drawn and plotted from point 1 to 2 in the direction of the bitcoin trend (Upward).
Because we think this is a short pause based on using this tool, we place a buy order between the 38.2% and 50.0% marks, with our stop loss just below the 61.8% mark. If you bought at this point in the example shown, you'd have gained a lot of pips.

Explanation for the Above Bitcoin Example
After the BTCUSD trade reached the 50.0 % mark, this area gave much help for the bitcoin price, and then the btcusd trading market started the original up bitcoin trend again & kept going higher.
23.60% offers minimal support and is not an optimal location to place an order.
The 38.2% retracement level offers minor counter-pressure, but in this specific bitcoin illustration, the price continued its decline towards the 50% zone.
50.zero% presents quite a few assist & in this case, this become the suitable point to set a purchase order.
For this exemplification, the retracement reached the 50.00 % pull back area, but most of the time the bitcoin trading market will retrace upto 38.2 % and therefore most times traders set their buy limit bitcoin orders at the 38.2 % level, while the same time setting a stoploss just below 61.8 %.
How to Draw on a Downwards Bearish Market
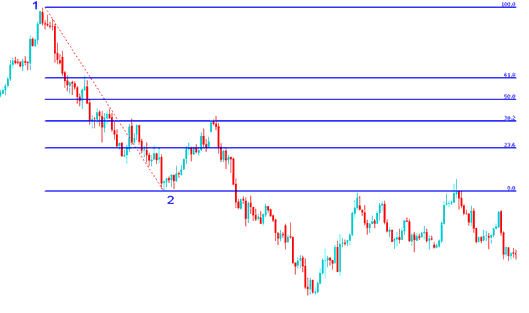
In the diagram below, the BTC/USD trading market declines from point 1 to point 2, then retraces up to a 38.20% level before continuing its descent in the original downward trend. This indicator is drawn from points 1 to 2 in the direction of the bitcoin trend (downward).
Recognizing this as a mere retracement opportunity, we place a sell order at the 38.20% Fibonacci level, setting the stop loss marginally above the 61.8% mark.
If you had strategically placed a sell order at the 38.2% retracement level, as depicted in the BTCUSD trade example below, you would have secured a significant number of pips. In that particular trade, the correction reached the 38.20% mark but did not extend to the 50.00% threshold. Experience suggests favoring the 38.2% level, as pullbacks often fail to reach the deeper 50.00% zone.

Explanation for the Above BTCUSD Example
The example above shows the perfect situation where the price of bitcoin goes back right after hitting the 38.2 % Level.
This level served as a significant resistance during market pullbacks, providing an ideal opportunity for investors to place sell-limit bitcoin orders before prices moved downward rapidly.
Learn More Courses & Lessons:
- Place a Future BTCUSD Request on MT5 iPhone App
- How can you look at and understand the BTC USD trend on Bitcoin chart signals?
- How to Trade Various & Different Types of Bitcoin Candles Patterns
- How to Trade Various Types of BTCUSD Candle Patterns Analysis
- How Can You Open Demo Account in MT4 Software Platform?
- One-Minute Time Frame Strategy for Bitcoin
- How to Open Standard BTC USD Account
- How to Trade MT4 Bitcoin Pending Trade Orders in the MetaTrader 4 Program
- How to practice trading BTC/USD with a demo account on MetaTrader 4
- Chaikins Money Flow BTCUSD Indicator Analysis in BTC USD Charts
