The Elliott Wave Bitcoin Trading Theory
This is a type of study that Bitcoin traders and other investors use to guess what will happen in btcusd trading by finding when investors are very emotional, highs and lows in bitcoin prices, and other group actions. This bitcoin trading idea shows that how people feel together grows and makes natural patterns over time, through buying and selling choices seen in market bitcoin prices.
This trading theory of analysis was developed by Ralph Nelson Elliott that's based on the theory that, in nature, a lot of things happen in a five wave market pattern. These patterns are also applied to technical analysis, to analyze and interpret the behavior of Bitcoin market trends using the theory.
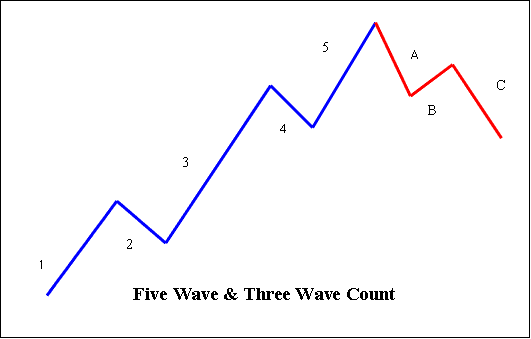
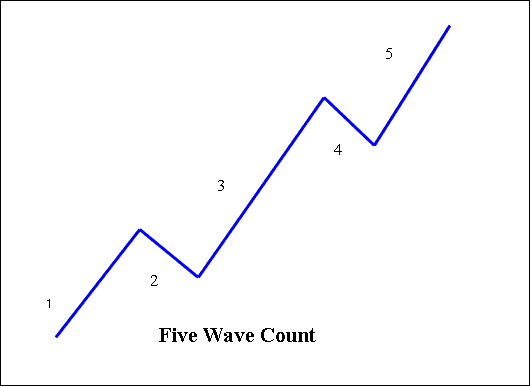
When this analysis theory is applied to Bitcoin, the assumption is that the btcusd trading market will advance in a pattern of five waves - three upward moves, numbered 1, 3 and 5 - which are separated by two downward moves, number 2 & 4. When the 3 up moves (1,3,5) are combined with the two down moves (2,4), they form the 5 Wave Elliott pattern.
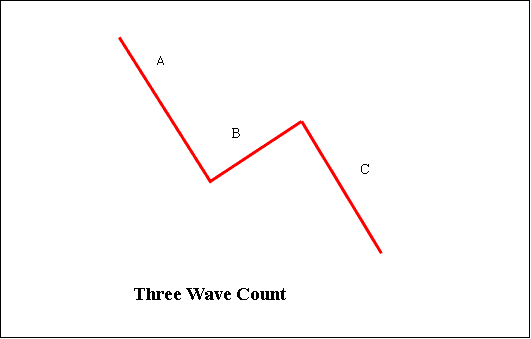
The theory says a five-wave rise leads to a three-wave drop. The down waves get labels A, B, and C. This sets them apart from the up waves.
5 and 3 Wave Pattern
The primary directional path of bitcoin is projected to consist of a five-wave sequence, while the corrective phase is anticipated to involve three distinct movements.
Five pattern formation (dominant trend) - uses 1, 2, 3, 4, 5
Three setup (corrective trend) - uses A, B, C

This article outlines a method for executing trades in online markets using Elliott Wave Theory as the core principle for analyzing cryptocurrency trading instruments. This methodology relies heavily on the analysis of BTCUSD price charts. Technical analysts apply this theoretical framework to assess emerging Bitcoin trends, seeking to identify wave patterns and forecast future price movements of Bitcoin.
By examining these patterns on a chart and employing the Elliott Wave Theory, Bitcoin traders can determine optimal entry and exit points by recognizing areas where the BTC/USD market may reverse.
It's easy to see this idea in action in the btcusd trading market, where changes in how investors feel are shown by how bitcoin prices move. If traders can spot patterns that happen again and again in bitcoin prices, and understand where these repeating bitcoin trading patterns fit within the Elliot pattern counts, then BTCUSD traders can guess where bitcoin prices will probably go next.
Rules for Elliott Wave Count
According to what this theory says about btcusd market patterns, there are some rules for what counts as correct:
- Wave 2 should not go below the start of Part 1.
- Wave 3 should be the biggest among Part 1, 3 and 5.
- Wave 4 shouldn't over-lap with Part 1.
Five pattern setup (dominant trend)

1: This initial phase is often difficult to recognize when it begins. As the first surge of a new upward market cycle commences, prevailing economic news is typically negative across the board. The preceding bearish trend is still widely believed to be firmly in control. Fundamental analysts continue to lower their projections, suggesting that the start of a new uptrend appears unconvincing. Market sentiment indicators remain pessimistic, and implied volatility within the BTC/USD pair is elevated. Trading volume might slightly increase with rising bitcoin prices, but not enough to alert a significant portion of technical analysts.
Number two fixes number one, but it cannot go further back than where wave one started. Usually, the news is still not good. As bitcoin trading prices test the previous low again, feelings of worry quickly grow, and everyone is reminded that the bear market is still happening. However, some good signs can be seen by those who are looking: the amount of trading should be less during number two than during number one, and bitcoin trading prices usually do not go back more than 61.80% of what was gained in part one. Bitcoin Price will reach a low point that is higher than the previous low point, resulting in a higher low point.
3: This is usually the biggest and strongest move up, bigger than 1 and 5. The news is now good, and experts start increasing their predictions. Bitcoin prices go up fast, and drops are quick and small. Anyone wanting to buy when the price goes down a little will probably miss the chance. As three starts, the news is likely still a bit bad, and most online traders still feel negative: but by the middle of part three, many people will join in and agree that the market now feels positive. Wave three will go higher than the highest point reached by 1.
Wave 4 acts as a clear pullback. Bitcoin prices often drift flat for a while. It usually pulls back less than 38.2% of wave 3. Trading volume drops way below wave 3 levels. Buy the dip here if you see wave 5 coming. Yet wave 4 can drag on the main uptrend.
5: This marks the last push in the main trend. News looks good for all. Most folks feel upbeat. Sadly, regular traders often jump in here. They buy just as bitcoin nears its peak. Wave 5 usually sees less volume than wave three. Momentum tools often show splits. Bitcoin hits a new high. Yet indicators fail to match it. At the close of a big uptrend, doubters face laughs. They tried to call the top.
3 Pattern (Corrective Trend)

Spotting corrections beats finding impulse trends in many cases. In wave A of a down market, news stays upbeat. Experts call the fall a pause in the bull run. Signs include higher volume, more volatility, and rising short interest.
B: Bitcoin prices change direction and rise a bit, which many people see as the return of the previously strong upward trend. People who know about standard analysis might view the highest point as the right part of a head and shoulders reversal bitcoin pattern. The amount traded during B should be less than during A. At this stage, the basic factors are probably not getting better, but they likely haven't turned bad yet.
C: Bitcoin prices drop in sharp moves. Volume rises. By the third wave of C, most see the downtrend is set. Wave C often matches wave A in size. It may reach the 1.618 Fibonacci extension past A's low.
More Topics & Courses:
- MT4 BTCUSD Trading Indicators for Bitcoin Described
- Upward Bitcoin Trend Line Crossover Reversal Strategy
- Best Time of Day to Trade BTC USD Cryptocurrency
- How to Use MT4 BTCUSD Trade Software Platform Platform Course Tutorial
- How Do I Interpret a BTCUSD Trade Lesson Guide Guide Guide Tutorial?
- Learn MT4 Bitcoin Charts & MT4 BTCUSD Chart Analysis for Beginners
- Introduction Guide for Trading MetaTrader 5 Mobile Trade App
- Spotting Bitcoin Breakout Patterns on a BTC USD Chart
- BTC USD Price Breakout after Inverse Head & Shoulders
- How to Open a Demo MT4 BTCUSD Trade Account in MT4 Platform Software
