Bitcoin Charts Analysis of Bitcoin Pattern Setups
Bitcoin Setups - Bitcoin Analysis Chart Setups Bitcoin StrategiesCryptoCurrency patterns are visual ways to show bitcoin price action patterns that happen again and again and are often used in the btcusd market.
Bitcoin patterns help traders spot repeating setups in their studies of market moves.
These patterns are important in bitcoin trading because when the BTCUSD market isn't going in a certain way, it's making a chart pattern. Knowing these chart patterns is important so you can have an idea of what the BTCUSD market might do next.
When you plot bitcoin's price movements, you'll spot a bunch of chart patterns that keep popping up again and again. Traders rely on these to try and predict what's coming next.
Traders often look at these patterns to figure out the forces of supply and demand that cause bitcoin price to change.
These Crypto Setups are classified into 3 various different categories:
1. Reversal BTCUSD Crypto Patterns
- Double tops Bitcoin Chart Patterns
- Double bottom Bitcoin Setups
- Head and shoulders Bitcoin Chart Patterns
- Reverse head & shoulders Bitcoin Setups
2. Continuation Bitcoin Setups
- Ascending triangle Bitcoin Chart Patterns
- Descending triangle Bitcoin Setups
- Bull flag/pennant Bitcoin Chart Patterns
- Bear flag/pennant Bitcoin Setups
3. Bilateral
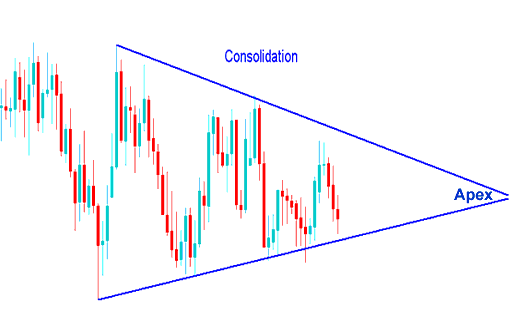
- Symmetric triangle - Consolidation Bitcoin Chart Patterns
- Rectangle - Range Bitcoin Setups Patterns
Reversal patterns - Bitcoin Chart Patterns - show when the btcusd market bitcoin trend is changing, once this reversal chart setup is confirmed. These Reversal Setups happen after the cryptocurrency trading market has been going up or down for a while, and they mean that the btcusd market is about to switch directions.
Continuation patterns Bitcoin Chart Patterns - are formations that set up the btcusd market for a bitcoin trend continuation movement in the direction of the previous Bitcoin trend. These Continuation Setups are formed when the btcusd market is taking a break before continuing heading in the same direction of the previous Bitcoin trend.
Bitcoin Chart Patterns that involve consolidation emerge when the crypto market for bitcoin pauses or takes a break prior to determining its subsequent course of action. During these consolidation setups, the BTCUSD market is in the process of deciding its trading trajectory.
Technical Bitcoin Chart Analysis of Bitcoin Chart Patterns
There are two distinct approaches to analyzing bitcoin charts: while superficially similar, they differ significantly: these two methods are:
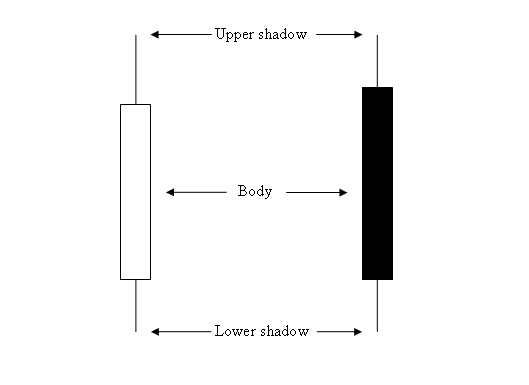
- Japanese Candlesticks - Study of a single candle - Reading Japanese Bitcoin candlestick patterns
- BTCUSD Setups - Study of a series of candlesticks formations
(This bitcoin trading tutorial focuses on the second strategy outlined above - Bitcoin Setups)
The different lessons for these 2 types analysis are:
Japanese Bitcoin Candles
Bitcoin Setups Tutorials
The images below highlight how these two analysis types differ in setup.
Candles Patterns - Study of a single candlestick

BTCUSD Formations - Examination of sequential candlestick formations for Bitcoin.

Study More Courses:
- Install BTCUSD Software on MT4
- BTCUSD MACD Hidden Divergence Setups BTC/USD Strategies
- Metaquotes Program MT5 Opening BTCUSD MetaTrader 5 How to Open Bitcoin Graphs
- How do you open a MetaTrader 5 practice account?
- How to Practice BTCUSD Using a BTC/USD Practice Account Demo Account
- Bitcoin Trading Learn Training Tutorials for Beginners
- Step-by-Step Explanation for Setting a BTC USD Trailing Stop Loss Order in MT4
- Tips for Choosing a BTC/USD Broker
- Best RSI BTC/USD Technical Indicator Combination
- MetaTrader 4 Expert Advisor (EA) for BTCUSD
