Relative Strength Index Bitcoin Trading Analysis & RSI Bitcoin Trade Signals
Developed by J. Welles Wilder, explained in the book "New Concepts in Technical Trading Systems".
RSI is the most popular indicator & it is a momentum oscillator and a bitcoin trend following indicator. RSI compares a bitcoin price magnitude of the recent bitcoin price gains against its magnitude of recent losses bitcoin price losses and draws this data on a scale of values which ranges between 0-100.
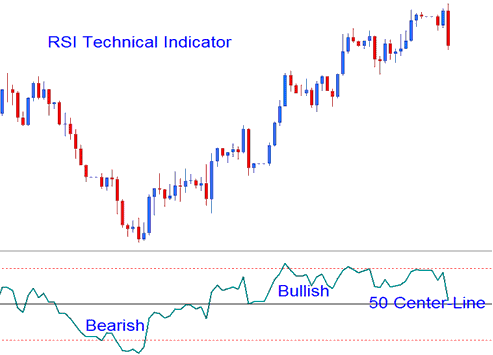
RSI measures the momentum of bitcoin crypto; values above 50 signify bullish momentum while values below 50 center-line signify bearish momentum.
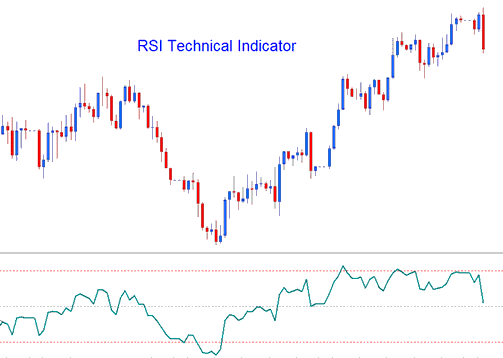
- RSI is drawn as a green line
- Horizontal dashed lines are plotted to identifying over bought & oversold levels are i.e. 70/30 levels respectively.
Bitcoin Analysis & Generating Trading Signals
There are several techniques used to trade, these are:
50-level Crossover Signals
- Buy signal - when the indicator crosses above the 50 a buy/bullish signal is given.
- Sell Bitcoin Signal - when the indicator crosses below 50 a sell/bearish signal is given.
RSI Bitcoin Chart Patterns
Traders can draw bitcoin trend lines & map out cryptocurrency chart patterns on the RSI indicator. The RSI often forms cryptocurrency patterns such as head & shoulders cryptocurrency pattern which might not have formed clearly on the bitcoin price chart.
Bitcoin Trading Support/Resistance Break outs
RSI is a leading indicator & can be used to predict Support/Resistance Breakouts before bitcoin price breaks its support/resistance level. RSI uses the swing failure signal to predict when bitcoin price is about to break resistance and support zones.
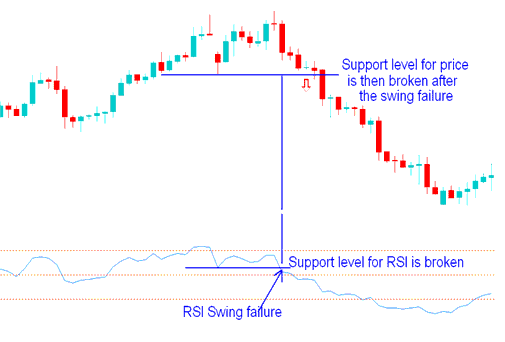
Swing Failure - Support and Resistance Breakout
Overbought/Oversold Conditions on Technical Indicator
- Overbought- levels above 80
- Oversold- levels below 20
These levels can be used to generate bitcoin signals such as when RSI turns up from below 20 after oversold, buy & sell when RSI crosses to below 80 after overbought, sell. These signals are not suitable for trading Bitcoin because they are prone to a lot of whipsaws.
Divergence Bitcoin Trading Setups
Divergence trading is one of the technical analysis method used to trade reversals of the bitcoin price trends. There are 4 types of divergences that can be traded with this indicator covered in the divergence tutorial on this web site.