Bilateral/Consolidation Crypto Currency Patterns Bitcoin Trading
With consolidation patterns in Bitcoin trading, the btcusd market can take various directions. There are two distinct types of cryptocurrency chart patterns that illustrate consolidation on charts:
- Symmetric Triangles - Consolidation bitcoin trading chart patterns
- Rectangles - Range market
Consolidation BTCUSD Patterns
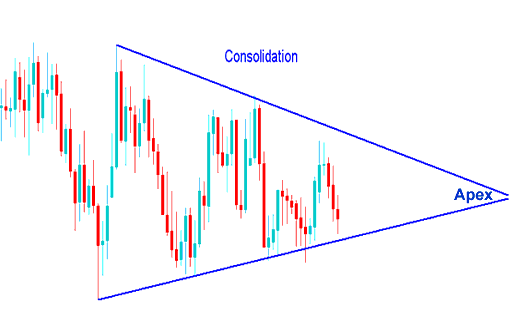
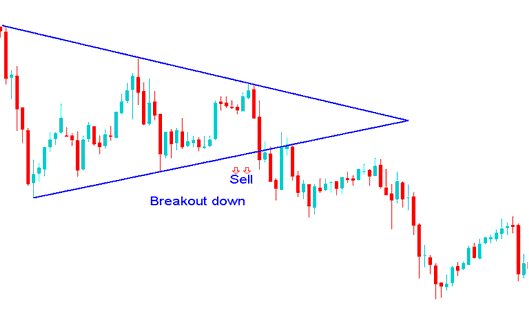
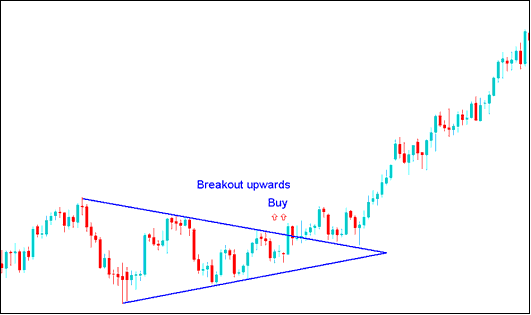
Symmetrical triangles are chart patterns in cryptocurrency characterized by converging bitcoin trend lines, which signify a consolidation phase. The buying opportunity from a symmetric triangle occurs at the upward breakout, while a downward breakout serves as a technical sell signal for cryptocurrencies. Ideally, a market will break out from a symmetrical triangle before reaching the apex of the triangle.
Draw Bitcoin trend lines by linking the lows and highs from the consolidation phase. These BTCUSD lines stay symmetric. They meet at an apex point. Expect a breakout between 60% and 80% of the triangle pattern on the crypto chart. Breakouts too soon or too late often fail. They prove less dependable. Once BTCUSD price breaks out, the apex acts as support or resistance for Bitcoin. A price that broke from the pattern should not drop back past the apex. Use the apex as a spot to set stop losses on open Bitcoin trades.
When these kinds of chart shapes appear while trading, we can tell that the btcusd market is stopping for a moment to decide which way it will go next.
These consolidation chart patterns appear when there is strong disagreement between buyers and sellers, and the btcusd market cannot decide which way to go.

Consolidation Bitcoin Pattern
Chart patterns like this won't last. Like a tug-of-war, one side wins. See the crypto chart: consolidation breaks out one way. How do you pick the right side?

A bearish signal to sell Bitcoin triggered by a downward break from a period of price stagnation.

Breakout Upwards Buy Bitcoin Signal after a Consolidation Pattern
Returning to the core query: how can we ensure our participation remains aligned with the ultimately successful side of the market?
Wait for bitcoin price to cross a line. Then place buy or sell orders that way. After a pause, buy if it breaks the top line. Sell if it drops below the bottom one.
Alternatively if you do not want to wait out for the consolidation trading pattern, you can use pending cryptocurrency orders. If you'd want to learn more about pending orders navigate to lesson: Stop Entry Bitcoin Order Types
The 2 types of stop order types used to trade consolidation bitcoin trading patterns are:
- Buy Entry Stop An order to open buy at a point above btcusd trading market bitcoin price.
- Sell Entry Stop An order to open sell at a point below btcusd trading market bitcoin price.
These refer to cryptocurrency order instructions designed to initiate a buy action at a price above the current BTCUSD trading level, or to commence a sell action below that level.
Rectangle BTCUSD Pattern
A rectangle shape in a chart is when the price moves up and down within a small range, showing that the bitcoin market is taking a break. The price range is marked by two straight lines that run side by side, showing where the price usually bounces and stops. This pattern is shown on a bitcoin chart using a rectangle, which is why it's called a rectangle bitcoin chart pattern.
For this consolidation cryptocurrency chart pattern, bitcoin price forms multiple highs and lows which can be connected with horizontal bitcoin trend lines which are parallel to each other. This bitcoin pattern occurs over an extended period of time, giving the chart pattern its rectangle shape.
A break out of bitcoin price action from this consolidation chart pattern occurs when either of the horizontal line is penetrated & the trading range of the rectangle pattern is broken. An up side breakout is a buy crypto signal. A down-side breakout is a sell bitcoin signal.

Rectangle Pattern Crypto Currency - Consolidation Pattern
Bitcoin price leaves the tight range soon and climbs higher after breaking up.
Study More Topics & Lessons:
- MT4 Opening a BTC/USD Chart Guide Tutorial
- Trade Bitcoin and Open Live BTCUSD Account on MT5
- How to handle funds and use tools for managing money while trading.
- Chandes Trendscore Bitcoin Indicator Analysis Explained for BTC USD
- What Will Happen to BTC USD after an Ascending Triangle Appears?
- What is Different Between Buy Limit BTC USD Order & Buy Stop Bitcoin Order?
- What Will Happen to Bitcoin Prices After a Falling Wedge Appears?
- Expected Market Behavior in BTC USD Following a BTC/USD Pattern Breakout
- Day Trade Bitcoin Trend-lines BTC USD Method
- How to Draw Candles Trade Charts on Trading Charts
