Placing Gann Lines on Stock Index Charts in MetaTrader 4
The Gann Lines is the fourth option in the Insert Menu within the MT4 Indices Platform. Gann Lines Button is used to place Gann Lines on the Stock Index Charts & it is displayed below.
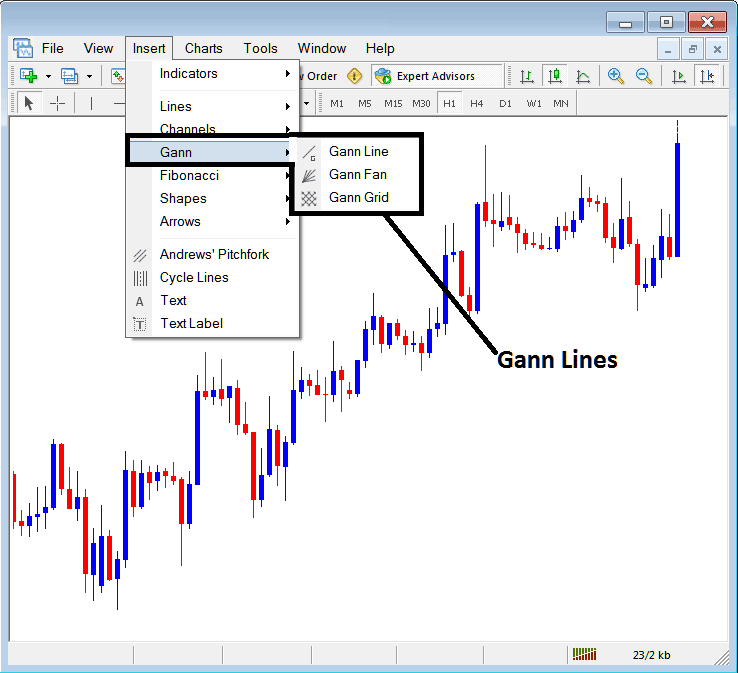
Drawing Gann Lines on MT4 Indices Candlestick Charts
Gann Line
The Gann Line is similar to a stock indices trend-line and to draw this stock indices trend line a trader must choose 2 points & draw this line between these 2 point, just like the trendline the Gann line is also used to show the trend.
However, the Gann Line might need you to change some parameter so as to achieve the draw that you require.
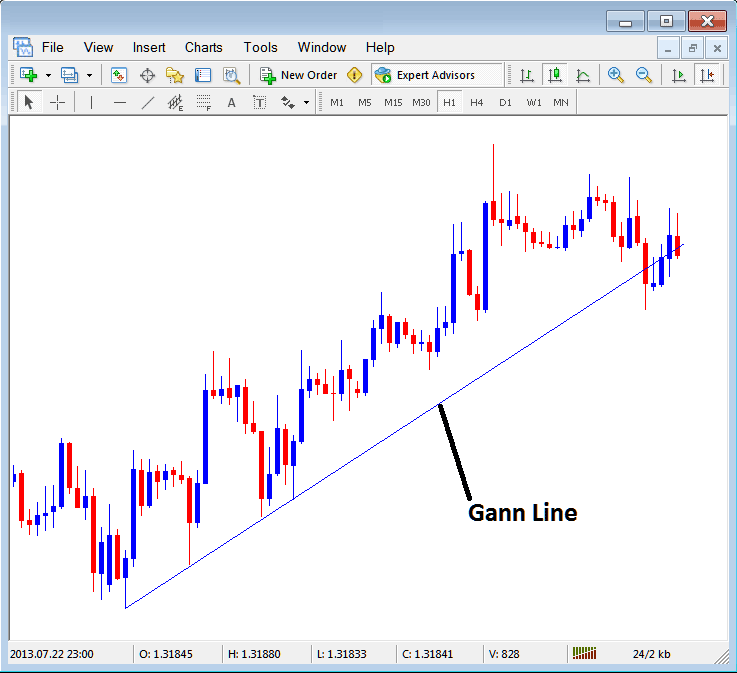
How to Draw Gann Line on MT4
Gann Fan
The Gann Fan is drawn between two points, this indicator will draw a set of stock indices trend-lines, these trendlines are drawn at different angles, This Fan will draw the middle line at an angle of 45 degrees as long as price is above this 45 degrees line then the momentum of the upward trend will continue as shown & illustrated below. If stock index price moves below this line in an upward stock indices trend the upward trend momentum might be reducing.
The Gann Fan is also drawn for a downwards stock indices trend and the same analysis applied to the downwards direction.
Example of Gann Fan on upwards trend:
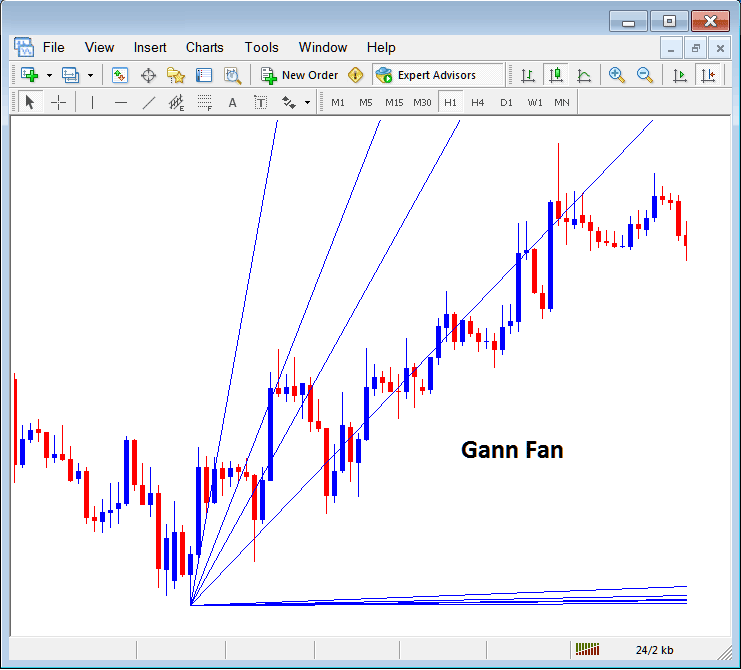
Gann Fan on MT4 Indices Candlestick Charts
Gann Grid
The Gann grid uses two points just like a stock indices trendline to be drawn, once these two lines are drawn, this Grid will then draw grids that are at an angle of 45 degrees, the traders can then use these grids for analyzing stock index price movement.
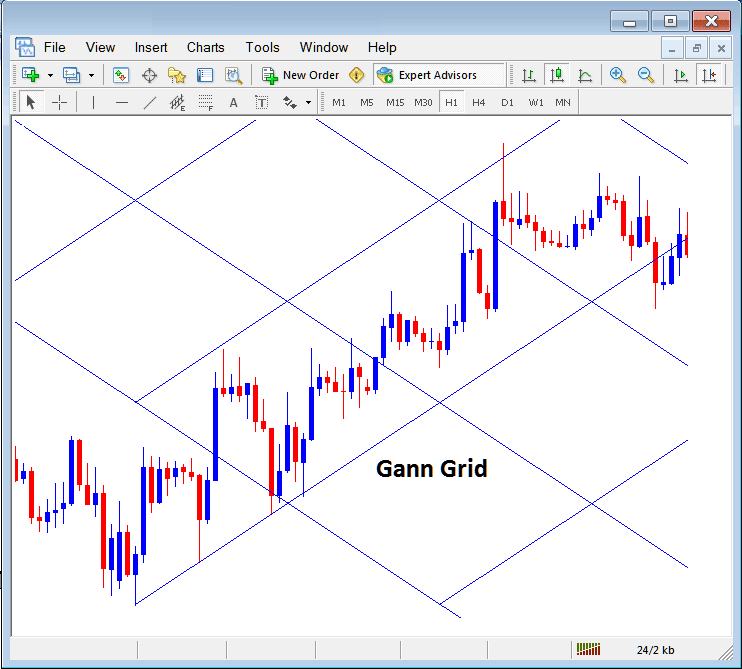
Drawing Grids on MT4 Indices Candlestick Charts


