Placing Fibonacci Lines on MetaTrader 4
The fifth option on the MT4 software insert menu is Fib Lines. The Fibonacci Lines Button has the following submenu buttons shown below:
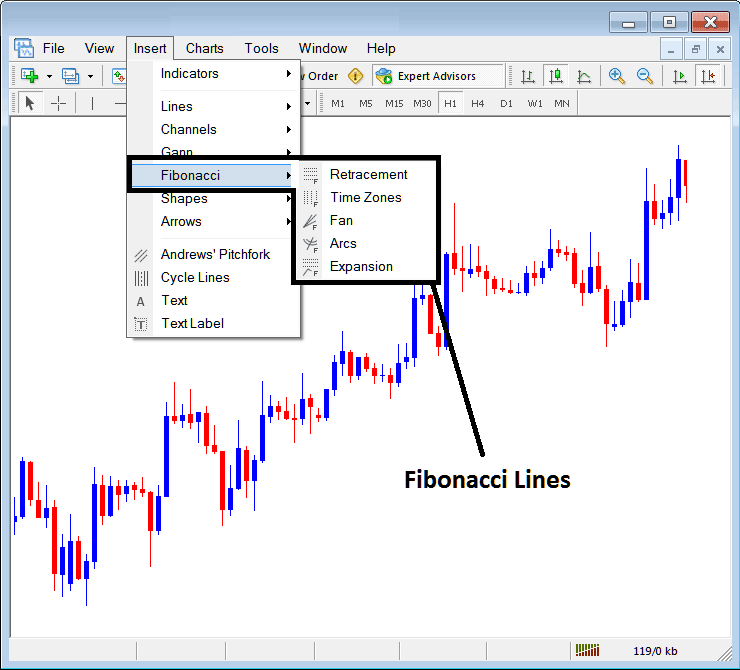
Fibonacci Stock Indices Trading in MT4
Fib Lines
- Indices Trading Fibonacci Retracement
- Stock Indices Trading Fibonacci Time Zones
- Stock Indices Trading Fibonacci Fan
- Stock Indices Trading Fibonacci Arcs
- Stock Indices Trading Fibonacci Expansion
Stock Indices Trading Fibonacci Retracement
The Fibonacci retracement can be placed on the a Stock Indices Trading chart from the Fibonacci retracement button key. Fib retracement is used to estimate where a stock index price retracement is likely to reach. The Fibonacci retracement levels are drawn as shown & illustrated below. To learn how to draw & use Fibonacci Retracement Levels read the tutorial: How to draw Fibonacci Retracement Levels:
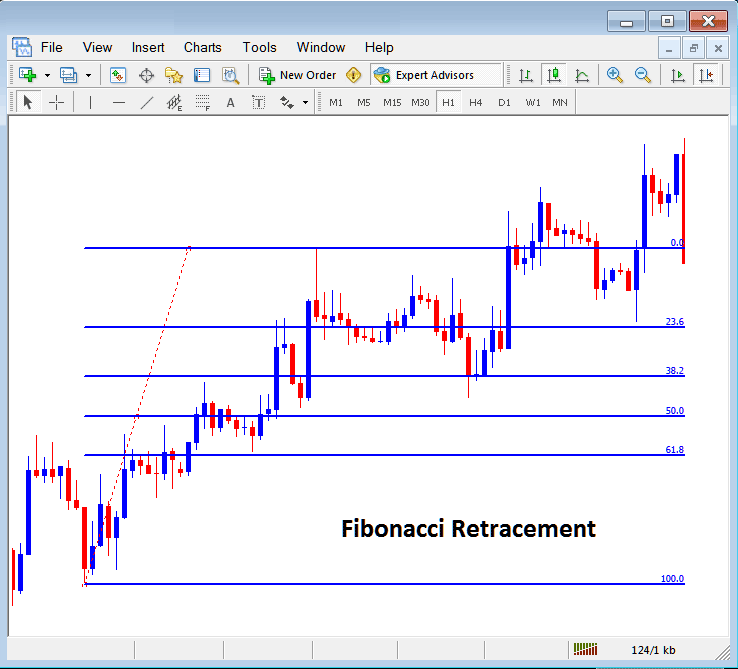
Fibonacci Retracement Levels Drawn on a Stock Index Chart on the MT4 Platform
Stock Indices Trading Fibonacci Time Zones
The Fibonacci time zones are Fibonacci lines drawn at different Fib timelines, these Fibonacci time zones are calculated using the Fibonacci points 1, 2, 3, 5, 8, 13, 21, 34. The Fibonacci levels are 1+2=3, 2+3=5, 3+5=8, first number add to the next, the next added to the second & so on.
The Fibonacci time zones are shown below, at these time lines stock index price changes are likely to occur based on technical analysis of Fibonacci time zones:
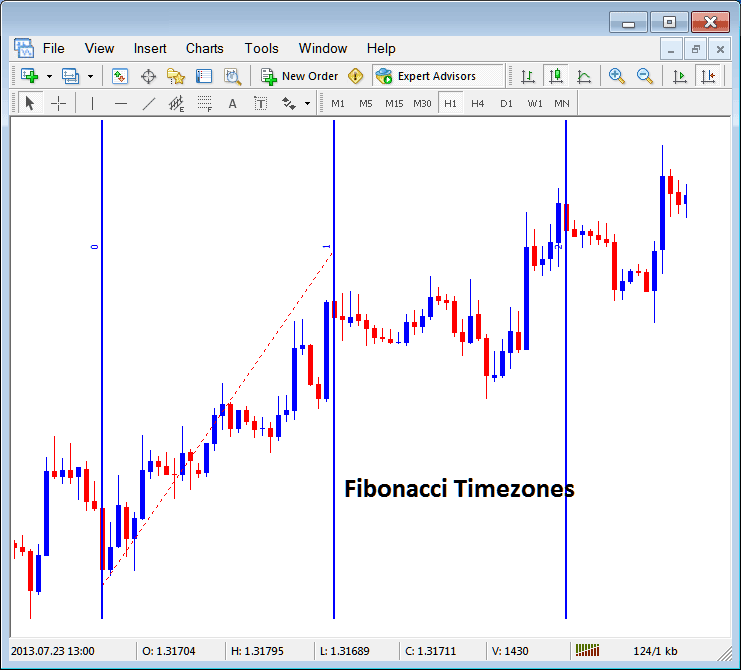
Fibonacci Time Zones in MT4
Stock Indices Trading Fibonacci Fan
The Fib fan is drawn between two chart points & then three additional lines below the stock indices trend are drawn as the fans, these are 38.2%, 50.00% & 61.8% Fibo retracement levels. The stock index price is likely to bounce and continue in the original direction after stock index price retraces to any of these fan lines.
The Fibonacci Fan Lines are drawn as shown below:
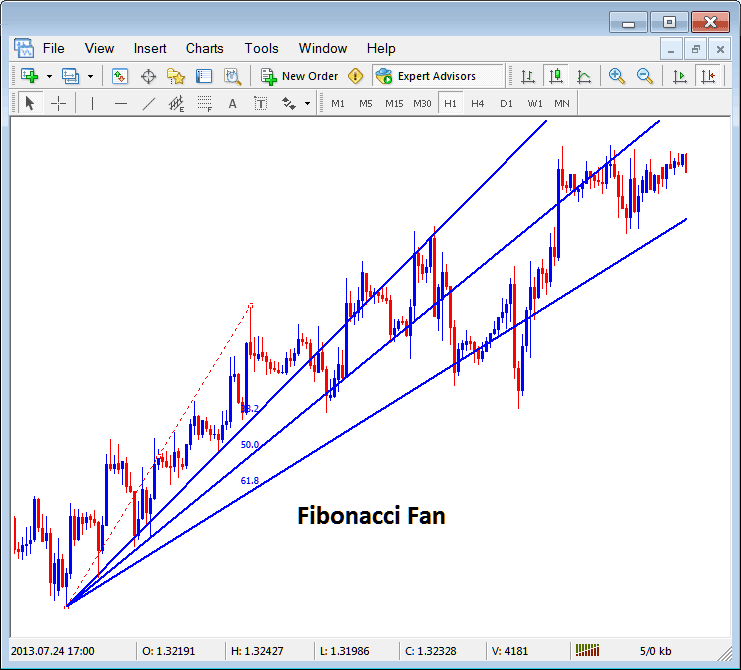
Fibonacci Fans on MetaTrader 4
Stock Indices Trading Fibonacci Arcs
Fib arcs are drawn using two chart points, the arcs are then drawn as shown and illustrated below & these arcs represent 38.2%, 50.0% & 61.8% Fib retracement levels.
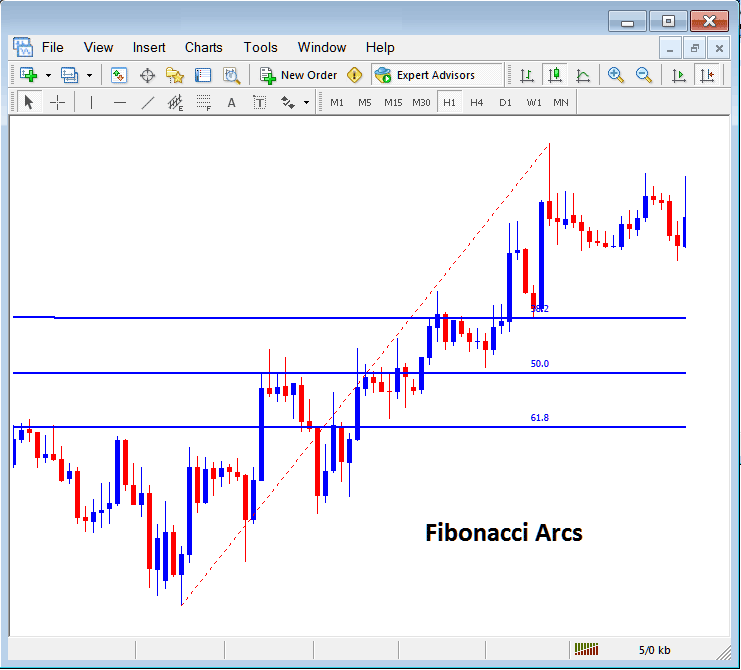
Fibo Arcs Representing Fibonacci Retracement Zones on a Stock Indices Chart
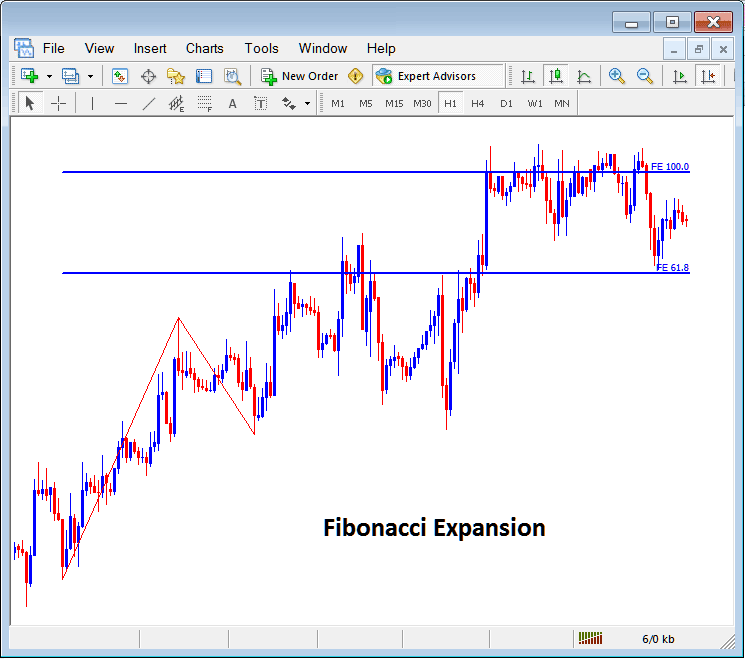
Stock Indices Trading Fibonacci Expansion
The Fibonacci expansion is used to determine most probable level at which traders should set their take profit levels based on Fibonacci expansion level 61.8% & 100.0% expansion levels. The Fibonacci expansion levels are also referred to as Fibonacci Extension Levels or Fibonacci Projection Levels by some traders & these Fibonacci Extension areas are plotted as shown below. Tutorial: How to Draw Fibonacci Expansion Levels:
How to draw Fibonacci Lines & other Fibonacci studies like Fibonacci Expansion and Retracement on MetaTrader 4


