Drawing Fibonacci Retracement Levels on Upward and Downward Trend
The stock index price on a stock indices chart does not move up or down in a straight line. Instead it moves up or down in a zigzag pattern. Fibonacci Retracement is the tool used to calculate where the zigzag will stop. The pullback levels are 38.2%, 50% and 61.8%. These form the points at which the stock indices market is likely to make a retracement.
What is retracement? It is a pullback of the stock index price before the stock indices market resumes the original trend/original direction of movement.
Examples of Zigzag Movement: The Examples below shows stock index price heading upwards in a zigzag pattern.
The diagram below shows movement in an upwards market.
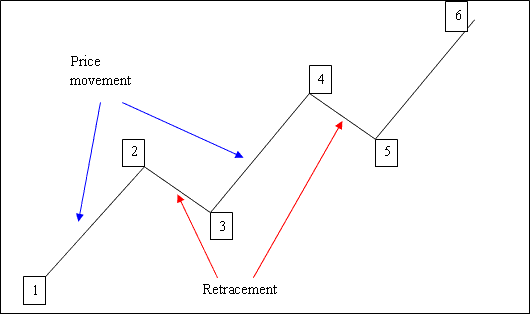
1-2: Indices Price moves up
2-3: Pullback
3-4: Moves up
4-5: Pullback
5-6: Moves up
Since we can spot where a pull-back starts on a Stock Indices chart, how do we know where it will reach?
The answer is we use Fib retracement tool.
This is a type of line study used in stock indices to predict and calculate these levels. This indices technical indicator is placed directly on the stock index chart within the platform provided by your broker, This indices technical indicator will then automatically calculate these levels on the chart.
What are The Retracement Levels
- 23.6 %
- 38.2 %
- 50.0 %
- 61.8 %
38.20% and 50.00% Levels are the most used and most of the time this is where the pull back will reach. With 38.20% being the most popular and most widely used.
61.8% is also commonly used to set stops for trades opened using this strategy.
This tool will be drawn in the direction of the trend as explained in the example below.
How to Draw on an Upward Bullish Market
In the diagram below the stock index price is moving up between 1 and 2 then after 2 it retraces down to 50.0% pull back area then it continues moving up in the original upward trend. Notice that this indicator is drawn from point 1 to point 2 in the direction of the trend (Upward).
Because we know this is just a pullback based on strategy of using this technical indicator, we put a buy order just between the areas 38.2% and 50.0% and our stoploss just below 61.8% pull back mark. If you had put buy at this point in the trade example illustrated below you would have made a lot of pips.
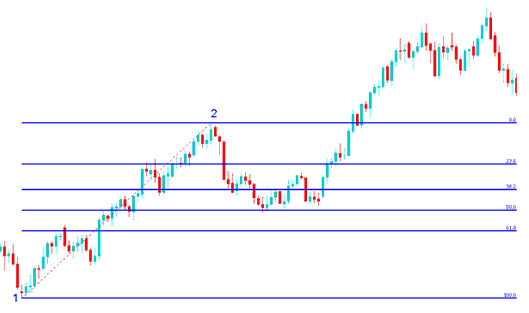
Explanation for the Above Stock Indices Trading Example
Once the trade hit the 50.0 % level, this zone provided a lot of support for the stock index price, and afterward stock indices market then resumed the original up stock indices trend & continued to move up.
23.6% provides minimum support & is not an ideal place to place an order.
38.2 % provides some support but stock index price in this example continued to retrace up to the 50% zone.
50.00% provides a lot of support and in this example, this was the ideal place to set a buy order.
For this example, the pull back reached the 50.00% pull back area, but most of the time the stock indices market will retrace up to 38.2 % and therefore most of the time traders set their buy limit orders at the 38.2 % level, while at the same time placing a stop just below 61.8 %.
How to Draw on a Downward Bearish Market
In the diagram below the stock indices market is moving down between 1 and 2, then after 2 it retraces up to 38.2% retracement then it continues moving down in the original downward trend. Notice that this indicator is drawn from point 1 to point 2 in the direction of the trend (Downward).
Because we know this is just a pull back we put a sell order at 38.2% level & a stop loss just above 61.80%.
If you had put sell order at the 38.20% level as shown on the trade below you would have made a lot of pips afterwards. In this trade the retracement reached 38.20% point and did not get to 50.0% mark. From experience it's always good to use 38.20% because most times the pullback doesn't always get to 50.0% mark.
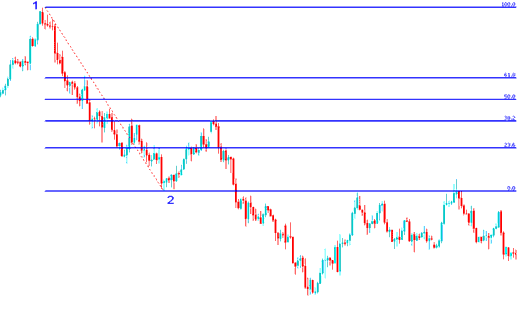
Explanation for the Above Stock Indices Trading Example
The above examples is the perfect setup where the price retraces immediately after touching the 38.2% Level.
This zone provided a lot of resistance for the pull back, this was the best place for an investor to place a sell limit order as the stock indices market quickly moved down after getting to this level.


