What is Williams Percent R Indicator? - Definition of Williams Percent R Indicator
Williams Percent R Forex indicator - Williams Percent R technical indicators is a popular forex technical indicator that can be found on the - Forex Indicators List on this website. Williams Percent R forex indicator is used by traders to forecast price movement based on the chart price analysis done using this Williams Percent R indicator. Traders can use the Williams Percent R buy and Sell Signals explained below to determine when to open a buy or sell trade when using this Williams Percent R indicator. By using Williams Percent R and other forex indicators combinations traders can learn how to make decisions about market entry and market exit.
What is Williams Percent R Indicator? Williams Percent R Technical Indicator
How Do You Combine Forex Indicators with Williams Percent R? - Adding Williams %R Indicator in MT4
Which Indicator is the Best to Combine with Williams Percent R?
Which is the best Williams Percent R Forex trading indicator combination for forex trading?
The most popular indicators combined with Williams Percent R are:
- Relative Strength Index
- Moving Averages Forex Trading Technical Indicator
- MACD
- Bollinger Band Indicator
- Stochastic Oscillator Indicator
- Ichimoku Kinko Hyo Indicator
- Parabolic SAR
Which is the best Williams Percent R indicator combination for Forex trading? - Williams Percent R MT4 indicators
What Indicators to Combine with Williams Percent R?
Find additional indicators in addition to Williams Percent R indicator that will determine the trend of the forex market as well as others that confirm the market trend. By combining forex indicators that determine trend & others that confirm the trend and combining these indicators with Forex Williams Percent R indicator a trader will come up with a Williams Percent R based trading system that they can test using a forex practice trading MT4 demo account on the MetaTrader 4 platform.
This Williams Percent R based forex trading system will also help online forex traders to determine when there is a market trend reversal based on the forex indicators signals generated and therefore traders can know when to exit the market if they have open forex trades.
What is Williams Percent R Indicator Based Trading? Indicator based forex system to interpret price and provide trade signals.
What is the Best Williams Percent R Forex Trading Strategy?
How to Select the Best Williams Percent R Strategy
For forex traders researching on What is the best Williams Percent R forex strategy - the following learn forex trading tutorials will help traders on the steps required to guide them with coming up with the best strategy for trading forex market based on the Williams Percent R indicator trading system.
How to Create Williams Percent R Forex Trading Systems
- What is Williams Percent R Indicator Trading System
- Creating Williams Percent R Forex Trading System Template
- Writing Williams Percent R Forex Trading System Rules
- Generating Williams Percent R Forex Buy and Williams Percent R Sell Signals
- Creating Williams Percent R Indicator Forex Trading System Tips
About Williams Percent R Indicator Explained
Williams Percent R Technical Analysis and Williams Percent R Signals
Williams %R Technical Indicator Developed by Larry Williams
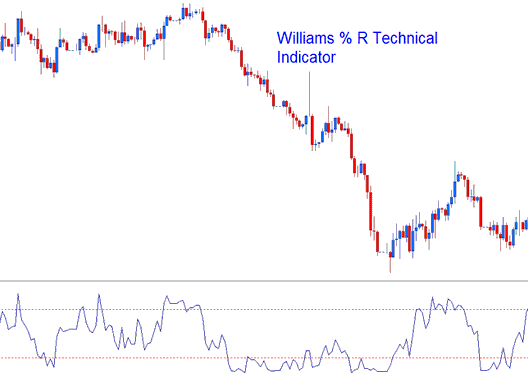
Williams %R indicator is pronounced as Williams percent R indicator. Williams %R Technical Indicator is a momentum oscillator used to analyze overbought and oversold levels in the forex markets.
The Williams % Range oscillator is similar to the Stochastic Oscillator indicator, apart from that fact that the %R is plotted upside down on a negative scale that is from 0 to -100 and the indicator does not apply a smoothing factor.
Williams %R, Percent R Trading Indicator - Forex Indicators
The Williams %R indicator analyzes the association of the closing prices relative to the High and Low range over a selected number of n candles.
- The closer the closing price of a candlestick is to the highest high of the range selected the closer to zero the %R reading will be.
- The closer the closing price of a candlestick is to the lowest low of the range selected the closer to -100 the %R reading will be.
When doing technical analysis a trader should ignore the minus sign placed before the value, for example -40, the - sign should be ignored, just remember the indictor values are placed in an upside down manner.
- At zero: If the closing price of the candlestick is equal to the highest high of the range the William %R reading will be 0.
- At -100: if the closing price of the candlestick is equal to the lowest low of the range the William %R reading will be -100.
Technical Analysis of Williams Percent R Technical Indicator
Overbought/Oversold Levels on Technical Indicator
- Overbought- William % R values from 0 to -20 are considered overbought while
- Oversold- Williams % R values from -80 to -100 are considered oversold.
As for trading overbought/oversold levels it is best to wait for a currency pair to change direction before taking a signal in the opposite direction. For Example if a currency pair is oversold it is best to wait for the trend to reverse and start to head in an upward direction before buying the currency pair.
FX Trend Reversal Signals
The William %R indicator used to predict a trend reversal signal when trading a currency pair. William % R indicator always predict a reversal using the following technique
Bearish Reversal Signal- Williams Percent Range indicator forms a peak and turns down a few days before the price trend peaks and turns down. The example below shows %R giving a reversal signal before price starts to head down and change to a down trend.
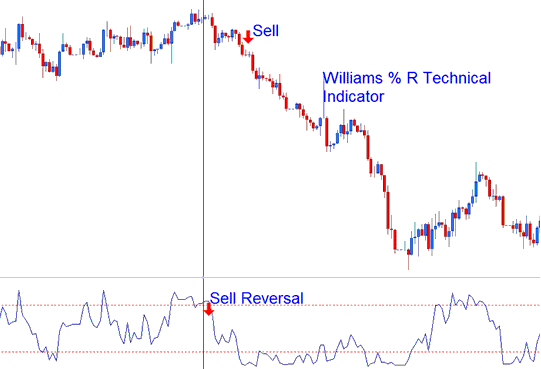
Bearish Reversal Signal after Forex Uptrend
Bullish Reversal Signal- Williams Percent Range indicator forms a trough and turns up a few days before the price trend bottoms and turns up.
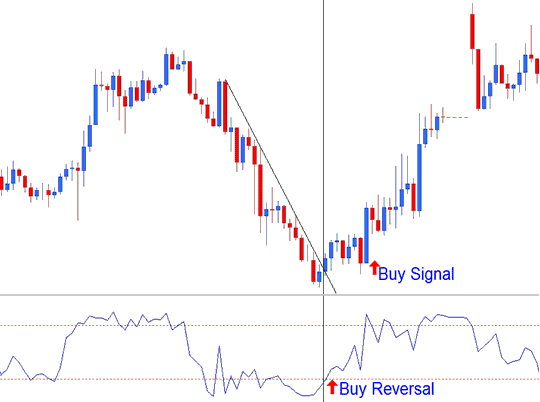
Bullish Reversal Signal after Forex Downtrend


