Rate of Change Analysis & Rate of Change Signals
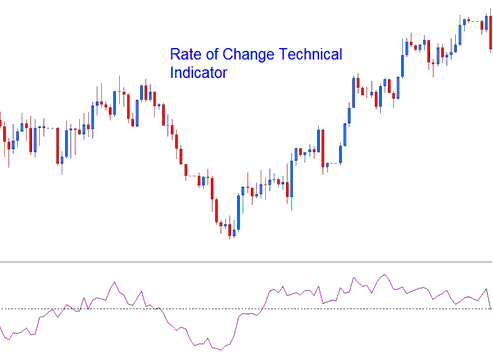
Rate of Change measures price shifts over set periods. It compares the current candle to past ones. The gap shows the change.
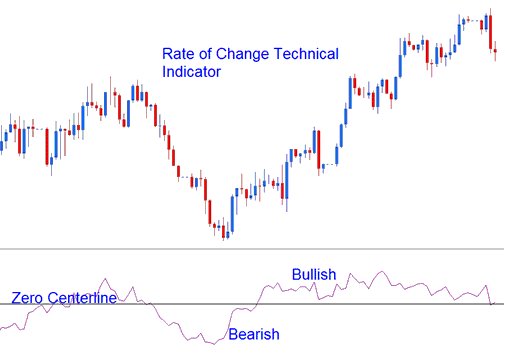
Differences can be assessed in both points and percentages. The Rate of Change (ROC) exhibits oscillatory behavior, fluctuating around a central zero line: values exceeding this line indicate bullish market conditions, while those below suggest bearish trends.
The greater the fluctuations in prices, the more significant the variations in the ROC Indicator.

XAU/USD Analysis and How to Generate Signals
The Rate of Change technical indicator can be employed to generate trade signals through several techniques, the most frequently used of which are:
Gold Cross-Over Signals
Bullish Signal Confirmation: A Buy Signal is Triggered When the Rate of Change (ROC) Crosses Above the Zero Center Line.
Bearish alert: Sell when Rate of Change drops below zero. It crosses the center line.

Oversold/Overbought Levels:
The higher the value above the overbought threshold, the greater the likelihood of an impending price correction for XAUUSD assets.
Oversold means the lower the value, the more oversold XAUUSD is. Below the level signals a coming price rise.
Nevertheless, during periods of robust market trends, the price can linger within the Overbought or Oversold zones for extended durations. Instead of reversing, the existing trend is likely to persist for a considerable time. Therefore, it is most prudent to rely on cross-over signals as the official indicators for buying and selling.
XAUUSD Trend Line Breaks
XAUUSD Trend-lines can be made on the ROC technical indicator just like trend-lines are made on price charts. Because the ROC is a leading indicator, trend lines on the technical indicator will break before those on the price charts. A xauusd trendline break on the Rate of Change shows a potential bearish or bullish reversal signal forming.
- Bearish reversal- ROC values/readings breaking above a downward trend line warns of a likely bullish market reversal.
- Bearish reversal- ROC values/readings breaking below an upward trend-line warns of a likely bearish market reversal.
Divergence XAUUSD
ROC can be used to trade differences, & to find possible market trend change signals. There are four kinds of difference setups: regular bullish, regular bearish, hidden bullish & hidden bearish difference.
Study More Lessons & Topics:
- How Do You Use MT4 ATR Tool in MT4 Software?
- What's USDHUF Spreads?
- Calculation Methodology for Determining Lot Size on a Cent Account within MetaTrader 4
- How to Put the Chaikins Money Flow Tool on a Trading Chart
- How to Place Relative Strength Index, RSI XAU/USD Indicator in MetaTrader 4 RSI XAU/USD Technical Indicator Analysis for Day Trade
- Do I Trade Crude Oil Online?
- FX Trading Software: Using the MT4 Periodicity Toolbar Feature
- How to Configure the Gator Oscillator in MT4
- XAU USD Spread Analysis
- How to Generate Signals in Forex with Methods
