RSI Forex Hidden Bullish Divergence and Hidden Bearish Divergence Trading Setups
Hidden divergence trading setup is used as a possible sign for a forex trend continuation. Hidden divergence set up occurs when price retraces to retest a previous high or low.
Hidden RSI Forex Bullish Divergence
Hidden RSI forex bullish divergence setup forms when price is making a higher low (HL), but the oscillator is showing a lower low (LL).
Hidden bullish divergence occurs when there is a retracement in a forex uptrend.
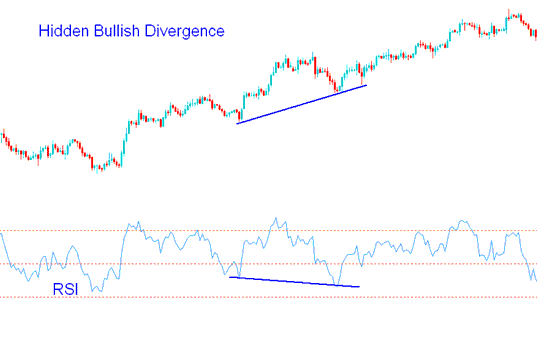
RSI Hidden Bullish Divergence - Hidden Divergence Forex Trading Setup
This hidden divergence set up confirms that a retracement move is complete. This hidden divergence indicates underlying strength of an upward forex trend.
Hidden RSI Forex Bearish Divergence
Hidden RSI forex bearish divergence setups forms when price is making a lower high (LH), but the oscillator technical trading indicator is showing a higher high ( HH ).
Hidden bearish divergence occurs when there is a retracement in a forex downtrend.
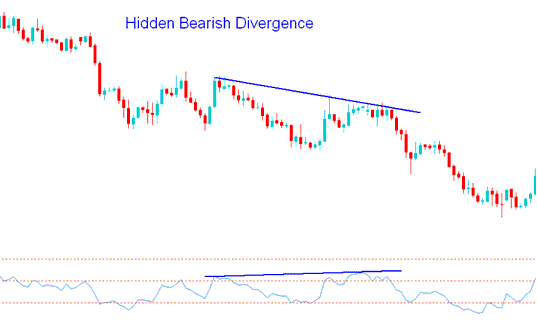
Hidden Bearish Divergence - Hidden Bearish Forex Divergence Trading Setup
This hidden bearish forex RSI setup confirms that a retracement move is complete. This divergence indicates underlying strength of a downwards forex trend.
